- At the time of writing, XMR was facing selling pressure in the market due to Kraken's delisting announcement.
- RSI and MACD measurements on the 4-hour chart of XMR/USD suggest a continuation of the downtrend
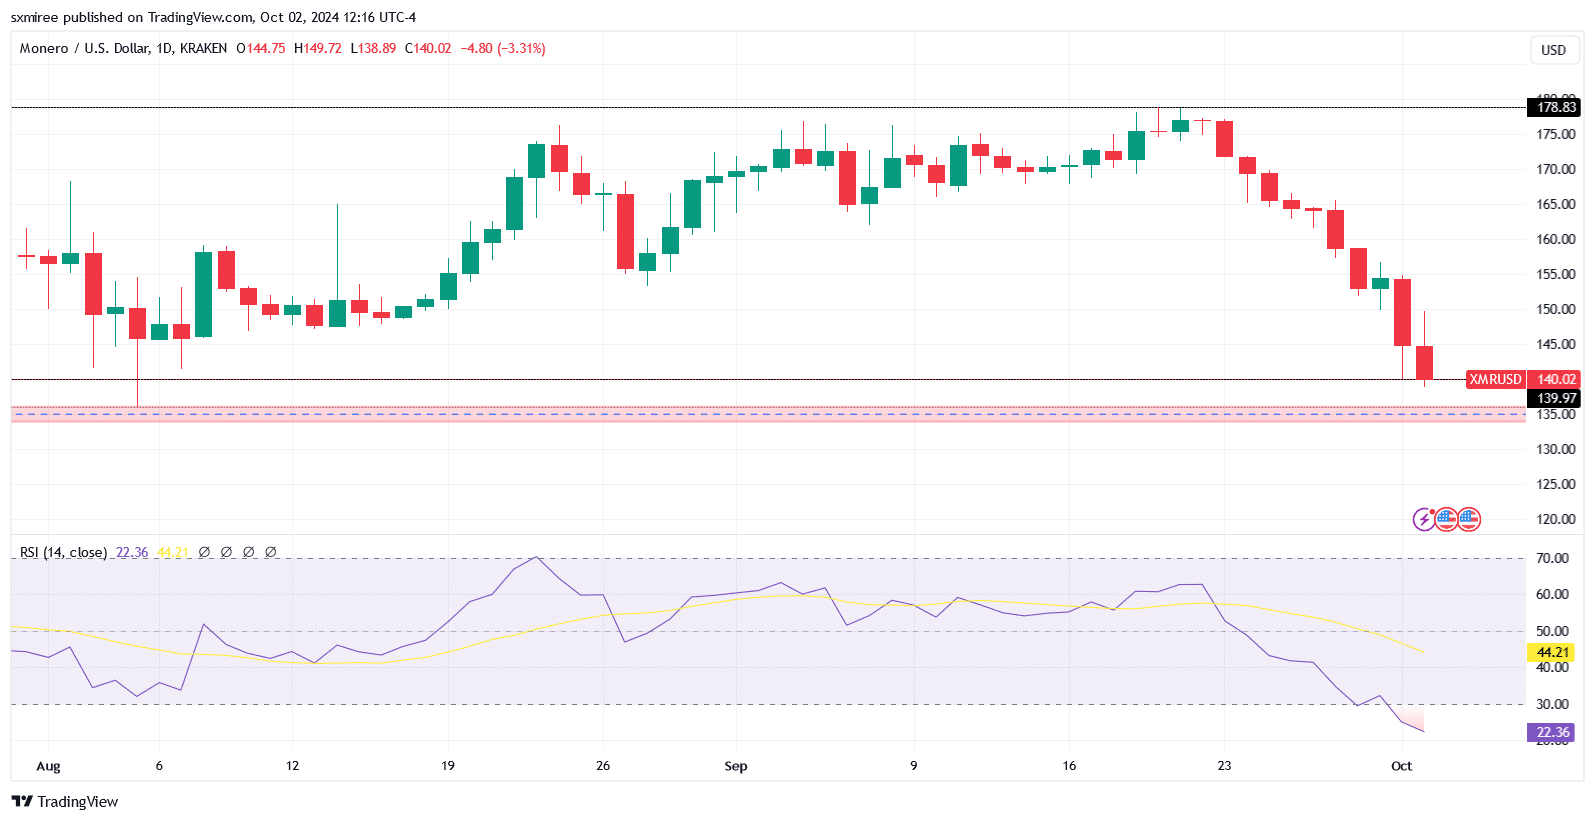
Monero (XMR) has been rocked by further headwinds in the market this week, falling below its long-standing October 1st support at around $146. The privacy-focused coin extended its decline earlier today, hitting an intraday low of $139 on the chart.
In fact, an evaluation of the XMR chart reveals that the daily candlesticks may be on track for a series of red values. This is due to the impact of eight consecutive days of low closing prices from September 23rd to September 30th.

Source: TradingView
At the time of writing, XMR is trading at $140, down 16% over the past 7 days. This week’s new downside move erased the gains since early August, when Monero (XMR) was trading near the $146 support.
Exchange delisting setbacks
Commentators blamed general bearish sentiment for Tuesday's plunge in prices. A similar situation was also fueled by tensions in the Middle East and Kraken's XMR delisting announcement.
In a notice to users registered in the EEA region, Kraken said it plans to stop supporting XMR by the end of this month. The exchange's decision to delist Monero for European users comes amid mounting regulatory pressure on privacy-focused coins used to facilitate illegal activities.
Kraken's move to suspend trading and deposits on all XMR markets in Europe came on the heels of similar actions by other exchanges. This has contributed to the bearish sentiment surrounding the coin.
bearish outlook
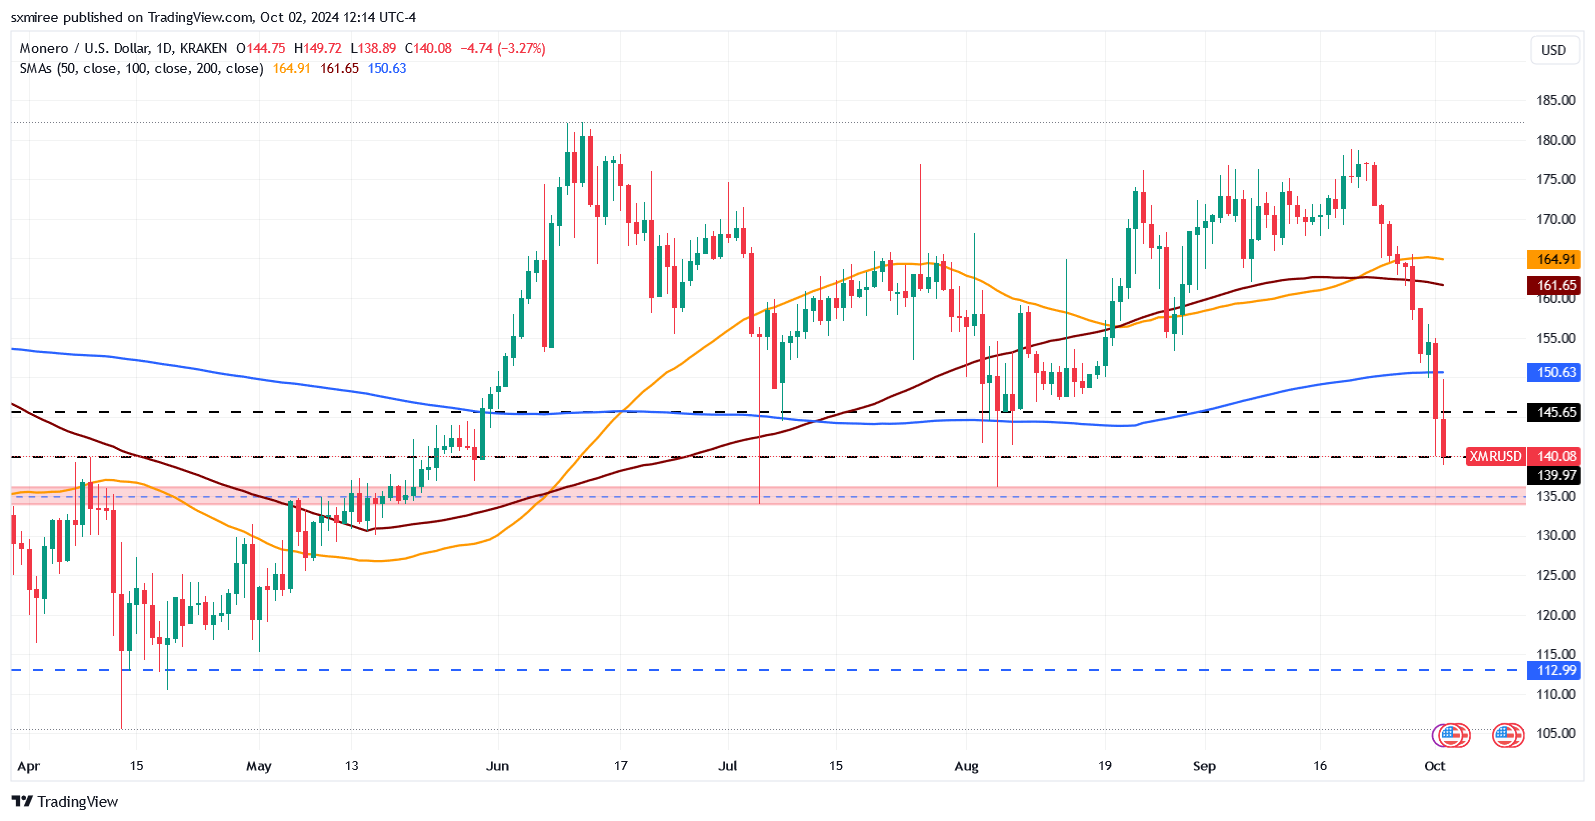
Technical analysis paints a negative and worrying outlook for Monero (XMR) as well. According to the paper, the price could head towards retesting the support range between $134 and $136.
This zone coincides with previous lows during the first week of July and August and represents a psychological threshold where traders monitor whether buyers will intervene.


Source: TradingView
A break below this floor could put XMR in an indecisive situation and open the door for further decline towards $112. This level previously acted as a major support in mid-April.
On the other hand, the relative strength index and moving average convergence divergence on the 4-hour chart reflect a very bearish outlook. In fact, today's 4-hour RSI reading has fallen into the oversold zone, indicating that XMR is still under strong selling pressure in a strong downtrend.
MACD analysis pointed out that momentum is firmly in the hands of the bears. The MACD line is below the October 1st signal line, suggesting that the downside is gaining momentum and could continue.
The MACD and signal line are still in negative territory at the time of writing, highlighting a sustained bearish trend.
Market sentiment and short positions
Finally, sustained market weakness means the path of least resistance remains to the downside. This could lead speculators to consider playing short.
However, a close above the 200-day SMA of $151 would signal a change in momentum and suggest a reversal.

