Monero's price has risen significantly over the past few months, but last week the altcoin's price movement slowed and XMR failed to secure any significant gains.
Monero is up just 1.5% over the past 24 hours, but bulls have been unable to sustain the recovery since it bounced back from $140 to $180 earlier this year.
Since recovering from the $130 levels, the coin has been attempting to move higher on the charts but the daily outlook for XMR is showing mixed signals.
Buying strength is positive but not significant, reflecting that buyers are still in control of prices, demand is present, and accumulation is growing.
XMR price hinges on whether Bitcoin can rise above $29,000 and approach the nearest resistance level. If XMR remains limited in the next trading session, it could tire out the bulls.
This will force the price to drop to local support. XMR’s market cap is showing an upward trend and the daily chart shows demand.
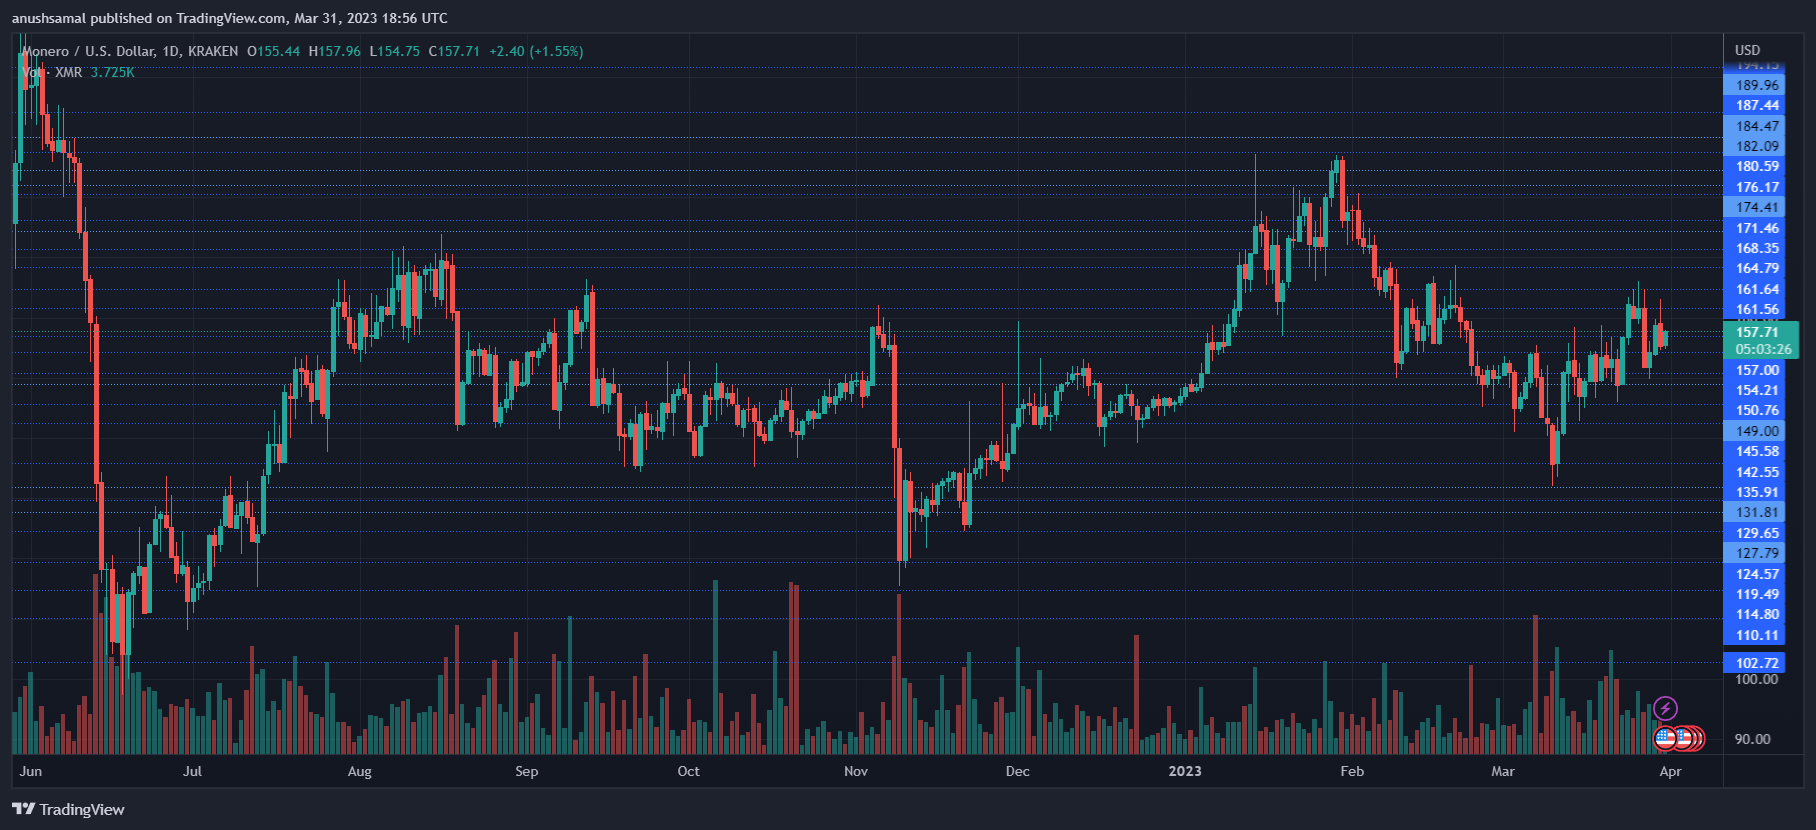
Monero Price Analysis: 1-day Chart

XMR is trading at $157 and the coin’s immediate overhead resistance is at $161. Buyers need a boost to help the altcoin break out of the above levels. However, even if XMR breaks out of the $161 level, bulls will not be secured unless it trades above the $168 price level.
Meanwhile, XMR found support at $154. If the price fails to sustain at that level, Monero might drop to $148. The volume of Monero traded in the last session is in green, which shows increasing buying strength on the daily chart.
Technical Analysis

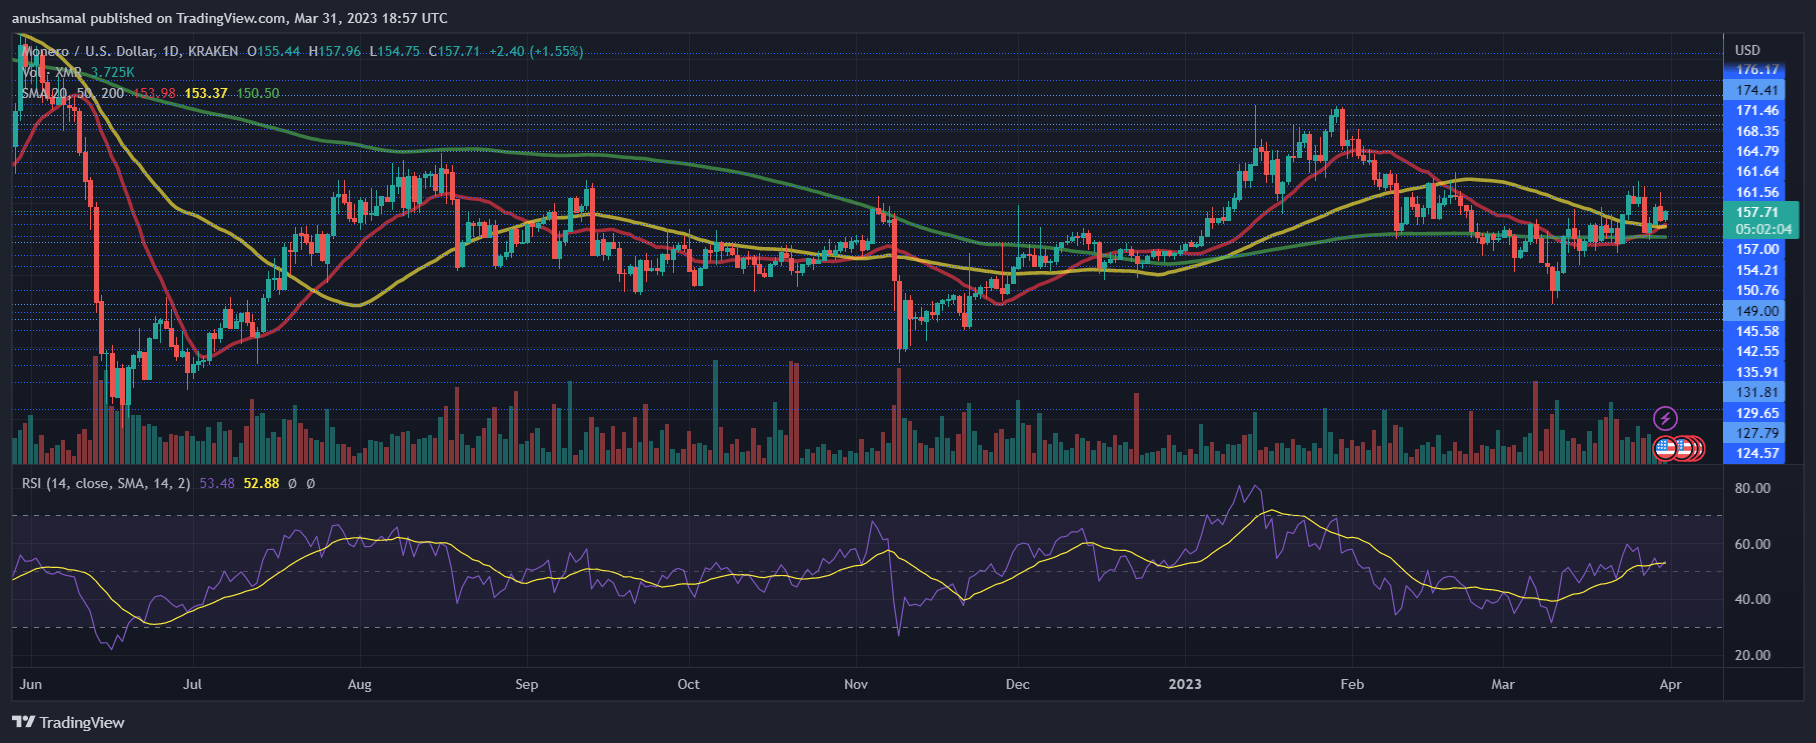
The altcoin buying momentum started to pick up slightly as XMR rose above the $154 zone. The Relative Strength Index is pointing up from the half-line, suggesting that buyers are gaining momentum on the daily chart.
Additionally, XMR price is above the 20 simple moving average, indicating that buyers are in control and driving price momentum in the market. Additionally, XMR is above the 50 simple moving average (green), suggesting that the bull run may continue.

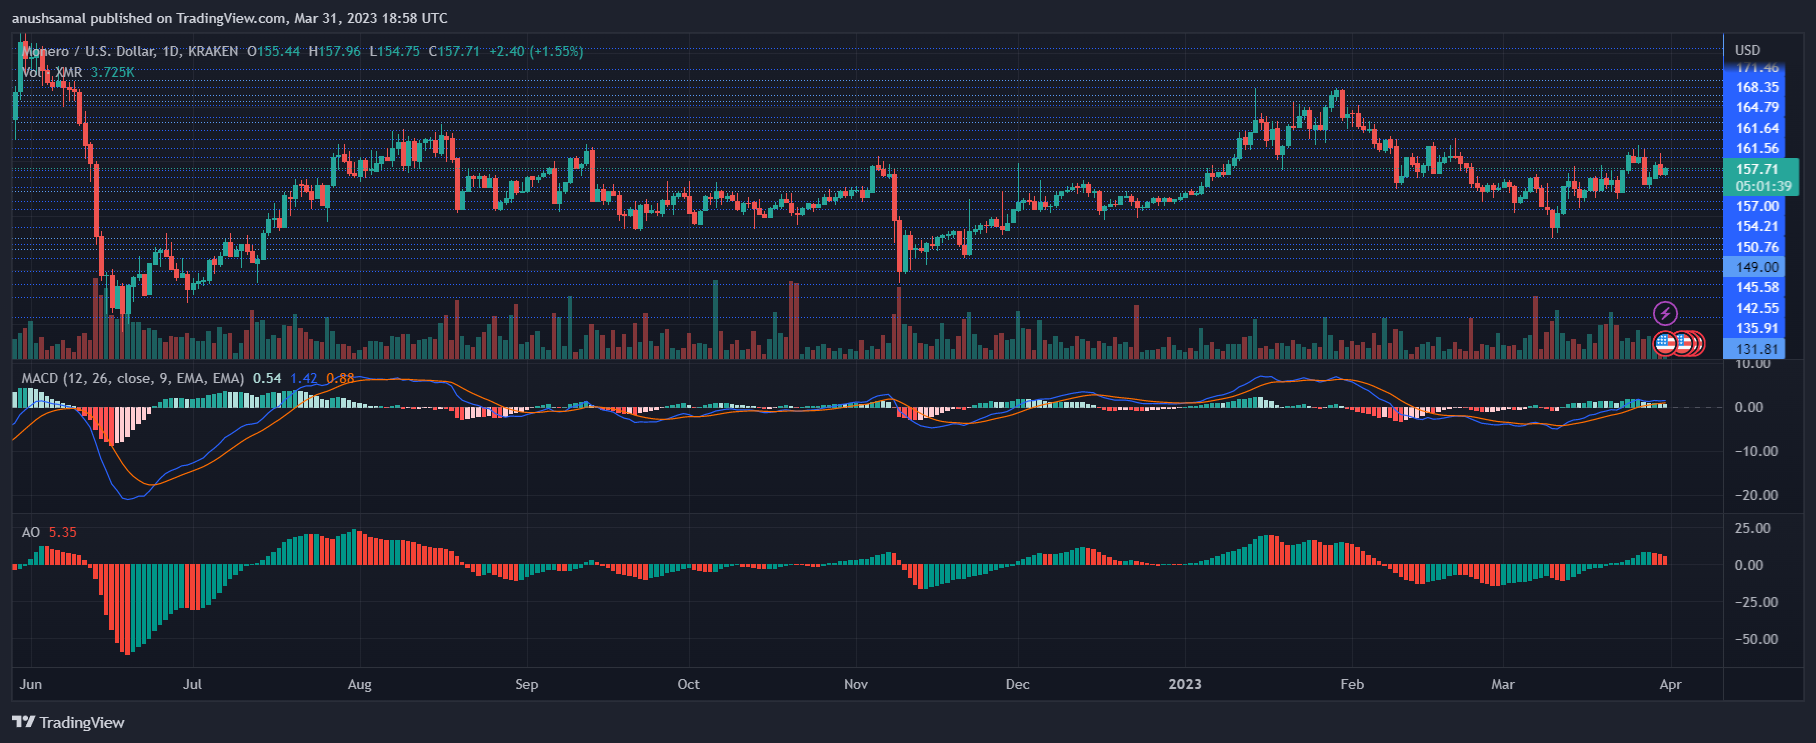
The buying sentiment in the market remained strong as the price movement on the charts was positive. The Moving Average Convergence Divergence (MACD) indicator, which shows the momentum and change in price, was positive and displayed a green histogram, indicating a buy signal for the coin.
Meanwhile, the Awesome Oscillator (AO) read the price movement and although buying strength was restored, the indicator was not yet reflecting any positive changes. The indicator painted red bars, indicating that buying strength was negative, but the size of these bars was decreasing.
Featured image from UnSplash, chart from TradingView.com

