Monero prices have been rising over the past week since the overall market recovery. Over the past 24 hours, XMR remained stable despite its weekly rise. The coin had been trading sideways for the past few sessions before starting to drop on the charts.
With momentum stalling recently, it remains unclear whether XMR will see another upward price movement. The coin’s technical outlook remains in favor of bulls despite sideways trading.
Despite the decline in demand in the past trading sessions, accumulation remains high on the charts. Monero is also showing overbought trends, meaning the recent drop in the asset’s value could be related to a price correction.
Related Documents
If Monero stays above the immediate support line, the altcoin can prevent major losses. Monero's market cap has declined slightly, which means the coin has faced selling in the past trading sessions. At the current price, the coin is trading 70% below the all-time high it achieved in 2021.
Monero Price Analysis: 1-day Chart

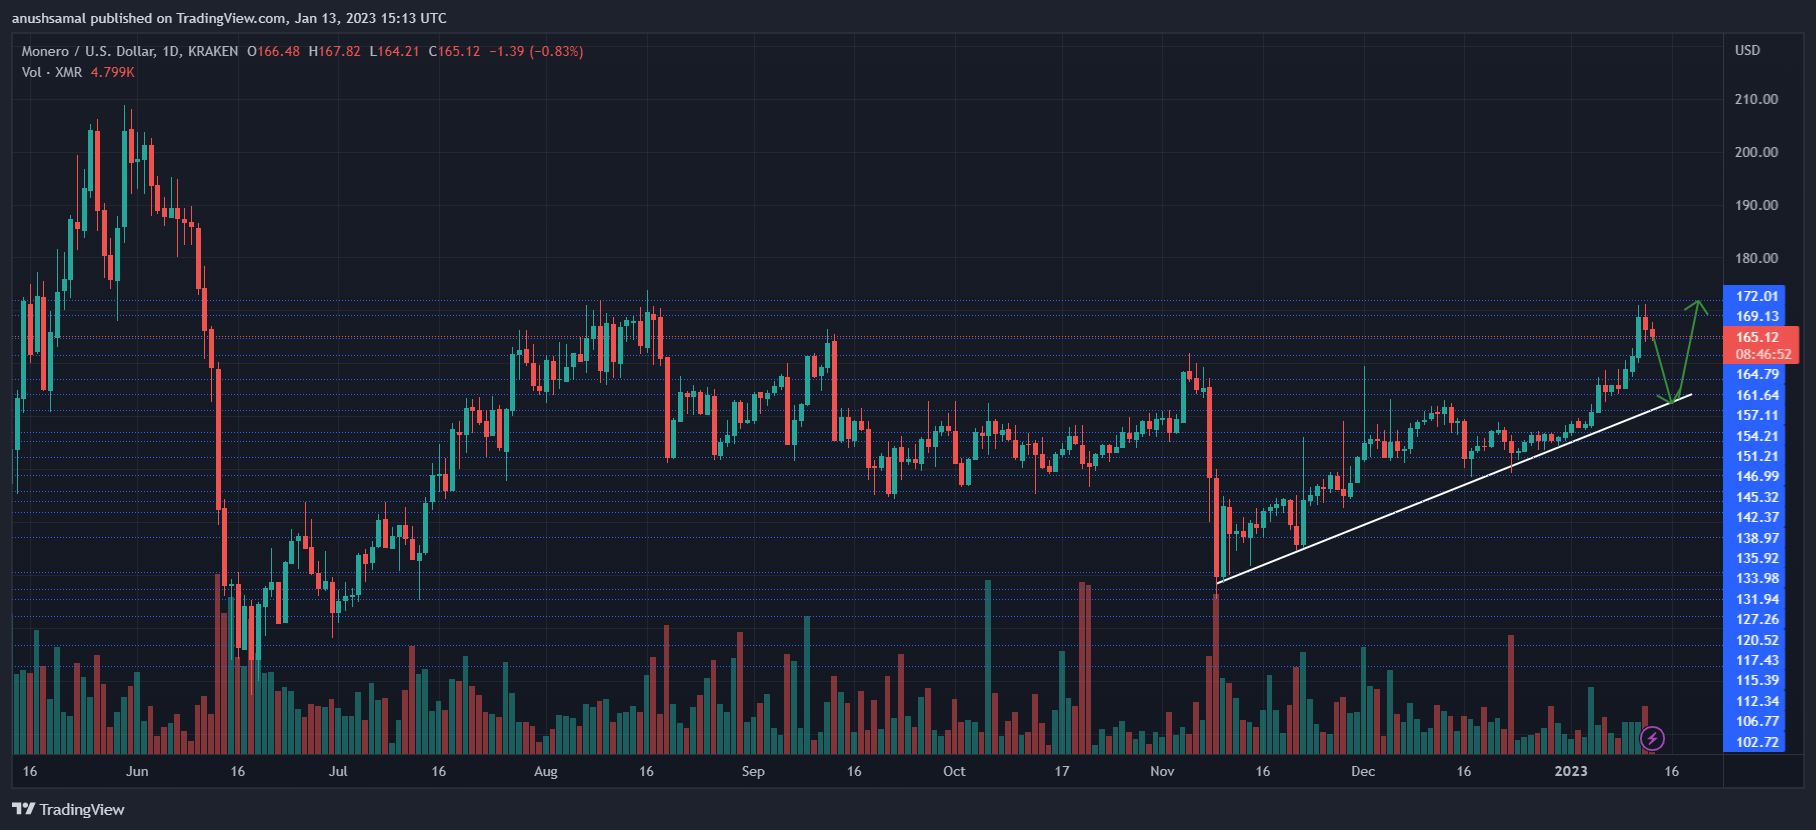
XMR was trading at $166 at the time of writing. Last week, the coin secured profits and broke through various resistance levels. The coin surpassed the resistance level at $157 and turned into a support zone.
Monero has been trading at an ascending trendline (white) which typically features breakouts to either the upside or downside. In the past 24 hours, XMR has deviated from the trendline and fallen on the charts.
This could mean that the coin will drop and get stuck at $163, then drop to $157 before rising again. In Monero’s case, there was a strong resistance at $169, which prevented the coin from crossing it.
The resistance above this line has not been breached since July of last year. The volume of Monero traded in the last session is in the red, indicating that the coin has faced some selling.
Technical Analysis

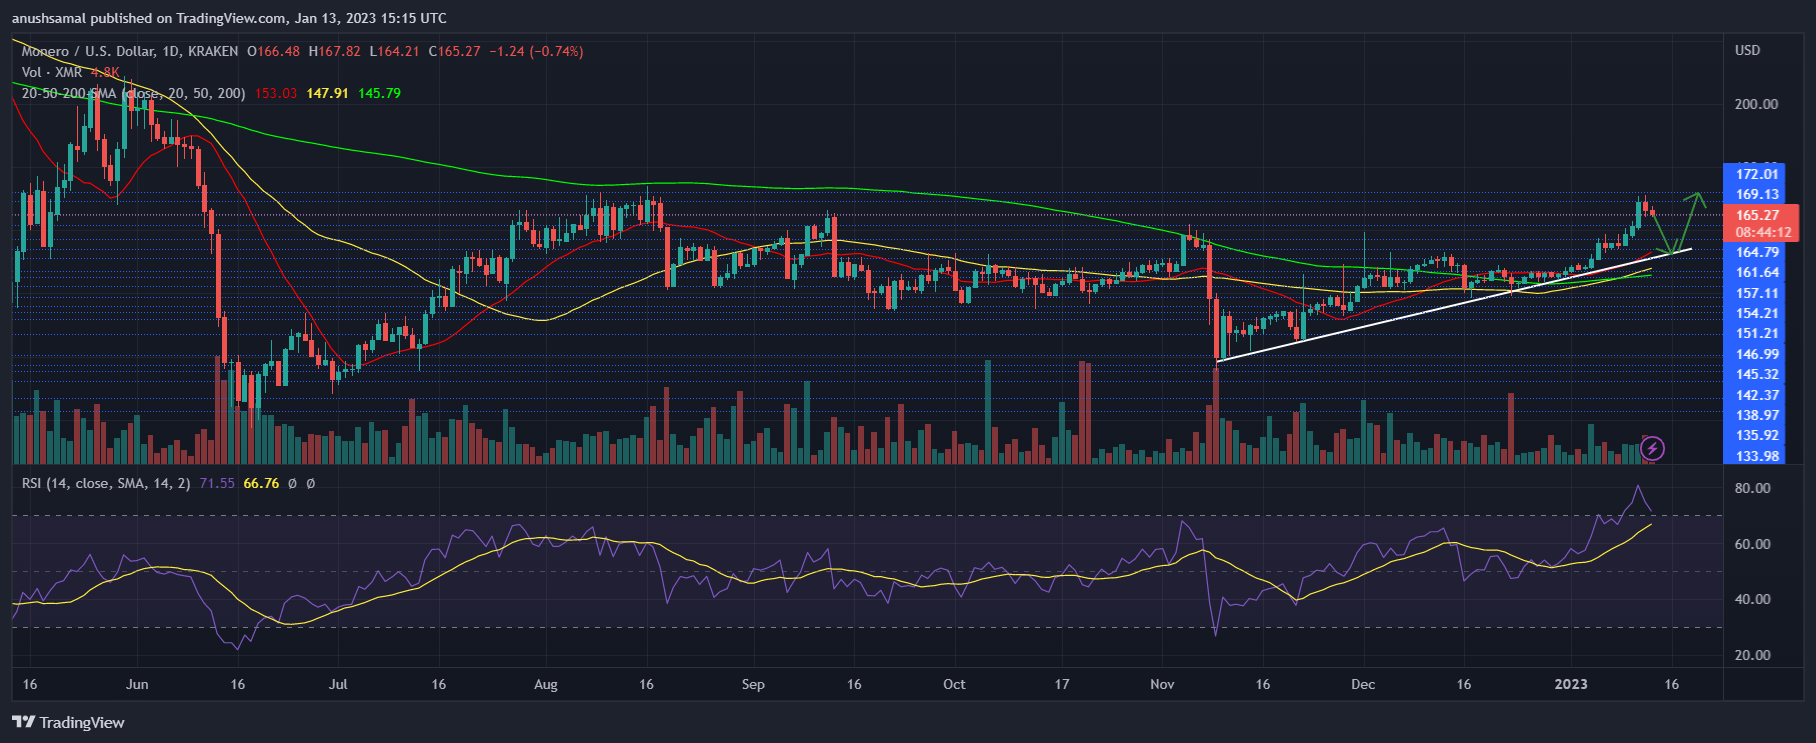
XMR reported a slight decrease in demand, but sellers were very few compared to buyers. The Relative Strength Index (RSI) is still above 70, which indicates that the asset is overbought, meaning that a Monero price correction is underway.
As a bullish sign, XMR is above the 20 Simple Moving Average (SMA), indicating that buyers are driving the price momentum in the market. XMR is also above the 50 SMA (yellow) and the 200 SMA (green).

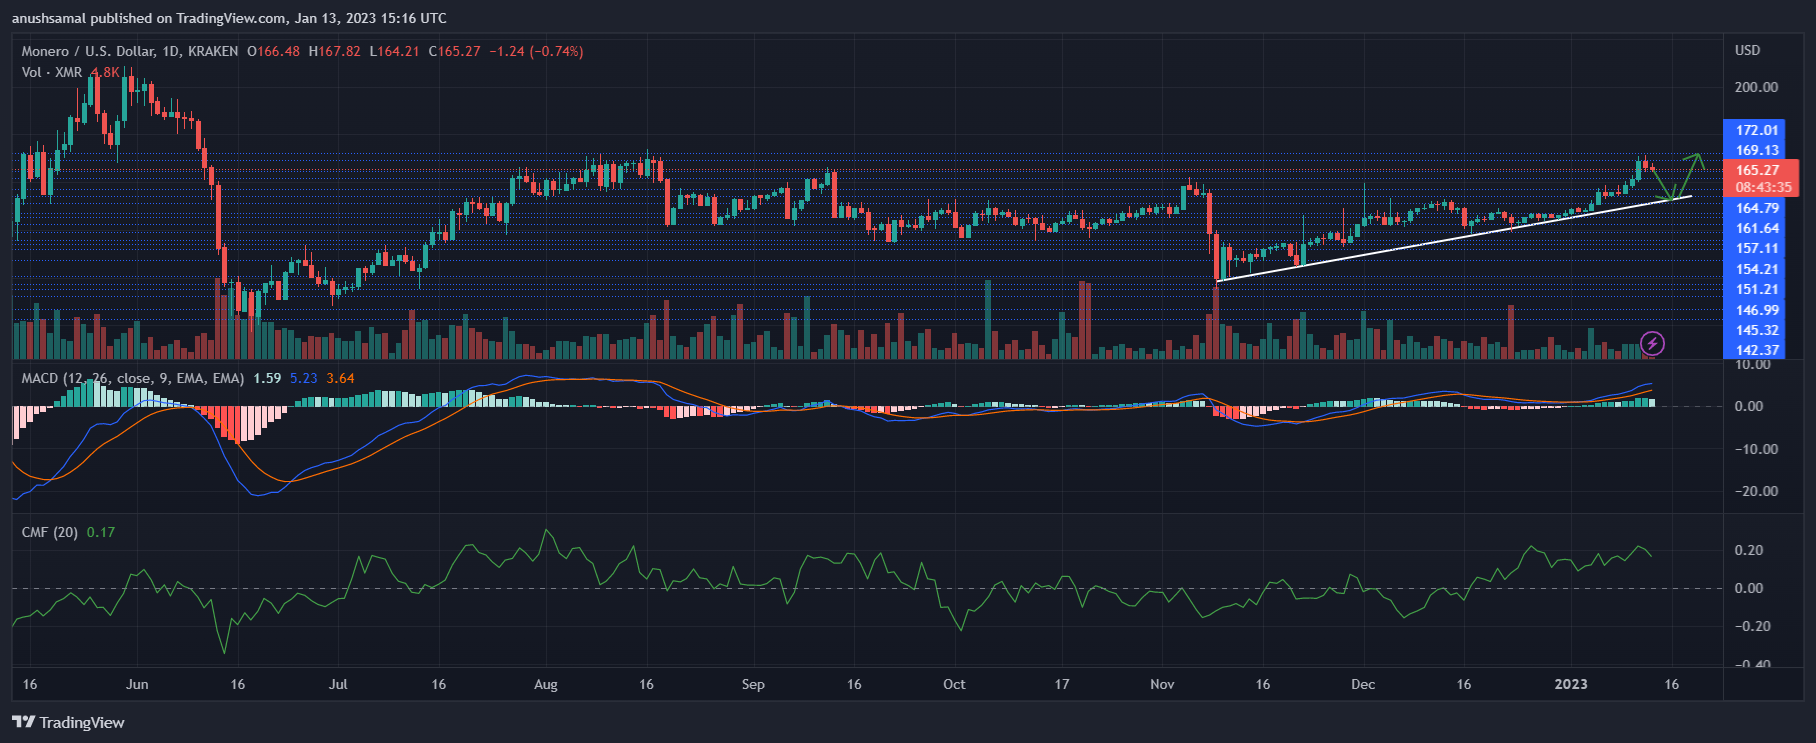
As the accumulation increases, the technical outlook is showing a buy signal. The Moving Average Convergence Divergence (MACD) reads the price momentum and trend reversal. The MACD has formed a green signal bar, but the height of the last bar has declined. This ideally means that the price is expected to move lower.
Related Documents
Chaikin Money Flow measures capital inflows and outflows. The indicator is above the halfway line, reflecting growing interest from institutional investors. Monero is on the list of assets that are doing well as the overall industry continues to recover. Still, the possibility of a price correction remains on the charts.
Featured image from Unsplash, chart from TradingView.com

