14:30▪
Ten
Takes a few minutes to read ▪
Crypto bull markets generally benefit altcoins in the second phase. In May, Ethereum (ETH) rose by more than 15% and is up about 65% since the beginning of the year. This Ethereum resurgence came after the SEC approved the creation of an ETF for the world's second-largest cryptocurrency. While the correlation between Bitcoin and Ethereum remains high, Ethereum price cyclicality seems to play just as precisely a role in the structure of this bull market. We decode Ethereum price indicators and dynamics.

Could an ETF soon come along to revitalize the market?
As with Bitcoin (BTC), the U.S. Securities and Exchange Commission has approved the creation of an ETF for Ethereum. The decision allows large global managers to expand their cryptocurrency offerings to their clients. However, commercialization is still pending approval by the SEC…
“The decision follows the successful launch of a Bitcoin ETF in January, which immediately saw an expected net inflow of $13.3 billion.“The launch of an Ethereum ETF could see similar success and spark new inflows into the second-largest cryptocurrency.”
Crypto Assets: Ethereum ETF Approved by SEC! – Cointribune
This announcement, especially for Bitcoin, triggered the price to rise to an all-time high. Therefore, the arrival of an Ethereum ETF leaves open the possibility of a retracement to the November 2021 high of $4,868. By May 2024, ETH will account for around 17.7% of the market cap. This market share is still far behind Bitcoin’s dominance of nearly 53%.
Therefore, the approval of an Ethereum ETF may trigger a catch-up effect compared to Bitcoin. Additionally, these ETFs may also be used to create ETFs representing baskets of cryptocurrencies in the future.
Fractals show the upswing continues
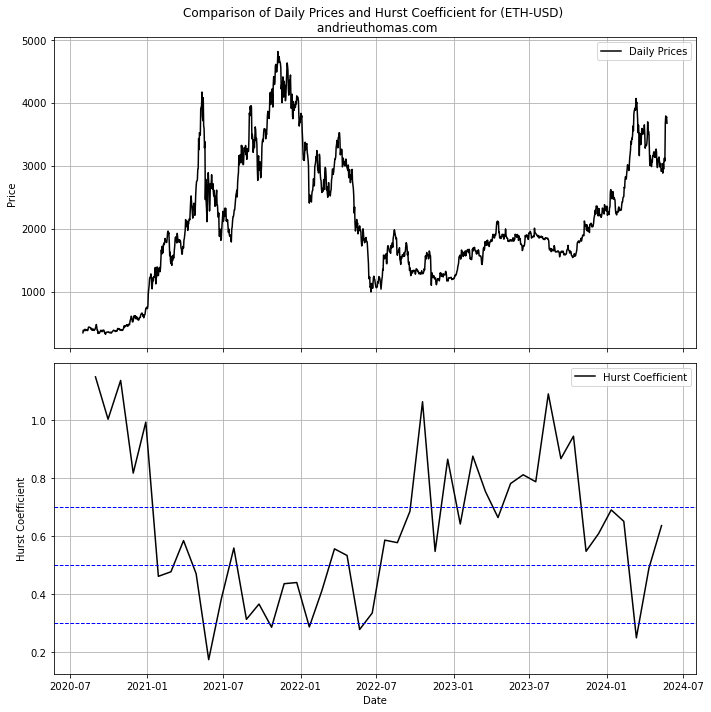
The main indicator for measuring the feasibility of ETH trends is through the use of fractals. In fact, the Hurst exponent (read more) allows us to measure the persistence of trends from one timescale to another. Moreover, the Hurst exponent is ideally bounded between 0 and 1. For Ethereum, a Hurst exponent closer to 1 indicates the potential for a significant upside, and as a result, good symmetry with major lows. Conversely, if the Hurst exponent is close to 0, it indicates that the trend is anti-persistent and is more likely to turn downwards.


Looking at the chart, we can see that ETH gained significant upside potential in mid-2022 and reaffirmed it in early 2023. According to the theory, subsequent bull markets are accompanied by a decrease in the Hurst exponent, indicating the loss of upside potential. In March 2024, the Hurst exponent fell below 30%, indicating bearish risk, or at least the lack of upside potential. However, Ethereum's recent bounce appears to reaffirm the revival of its upside potential, thereby limiting the bearish risks observed in spring 2024.
Despite everything, this approach encourages us to be more cautious about the nature of the bull market compared to 2023. Indeed, it seems clear that the bull market has exhausted a significant portion of its overall potential.
Cycles Affecting ETH
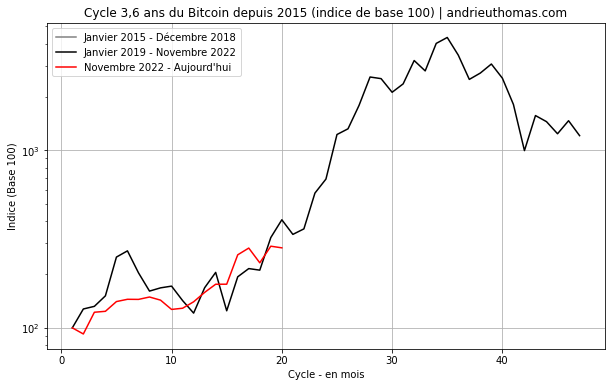
In several papers, we have had the opportunity to highlight Ethereum's near 3.6-year cycle. Moreover, this major cycle corresponds to the same major cycle as Bitcoin (BTC). Therefore, the timing of this cycle allows us to judge and compare different bull and bear markets. For example, the bull market observed in Bitcoin since 2023 is highly symmetrical to previous bull markets.
“In fact, we know that in February 2018, two cycles, one 4 months and one 22 months, were synchronized. Next, find the time required to achieve the following constructive interference: Calculate LCM(4,22) to get 44 months (3.6 years)This is strongly correlated with stock and Bitcoin cyclicality (Bitcoin Cyclicality (BTC) – Cointribune).”
Technical Indicators: Constructive and Destructive Interference – Cointribune
Thus, for Ethereum, there is a gap of just over 3.6 years between the major peak in 2018 and the peak in 2021. Similarly, there is a gap of 3.6 years between the major low in early 2019 and the major low in mid-2022. We see clear cyclical dynamics here, driven primarily by the correlation between Ethereum and Bitcoin. While this view is certainly theoretical, it is possible to predict that Ethereum will peak around mid-2025. Finally, I would like to mention the nice symmetry we have observed so far between the current bull market and previous bull markets.


ETH remains correlated with Bitcoin
In our previous paper, we highlighted the importance of the correlation between Ethereum and Bitcoin. The cryptocurrency market’s lows and major lows are indeed linked to the relationship that exists between the two major cryptocurrencies.
“In our case, we have found that high correlations between Bitcoin and Ethereum tend to lead to Bitcoin hitting large lows, while low correlations (significantly low coefficients) tend to lead to sharp weakening of market strength and large highs. The main explanation is that altcoins become less reliant on Bitcoin during bull markets.”
Bitcoin (BTC) will become uncorrelated with other assets – Cointribune


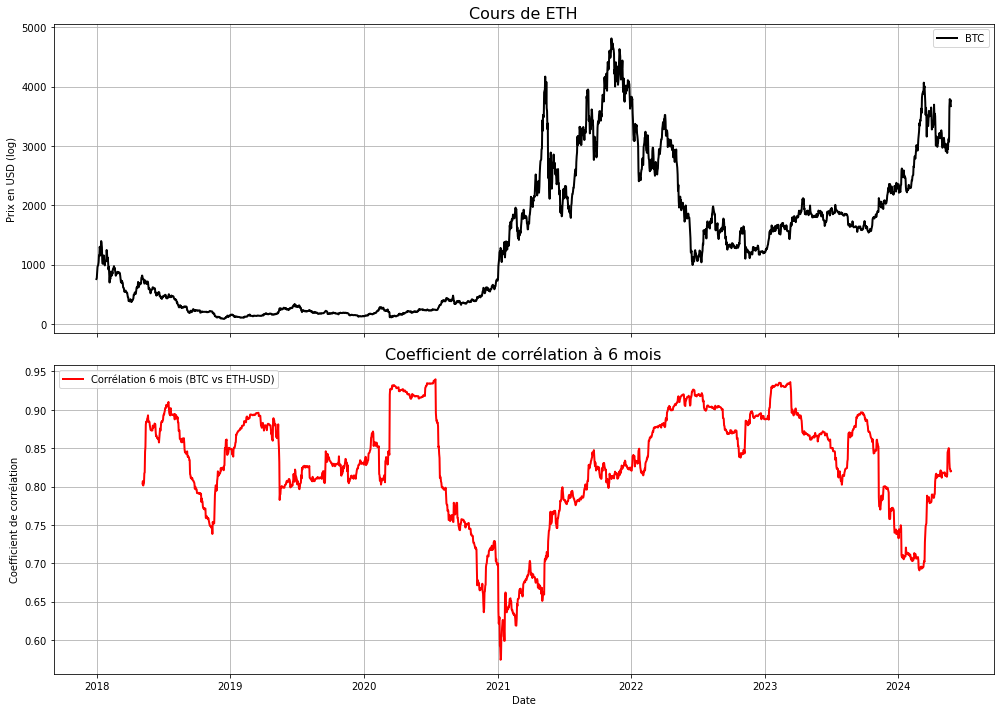
From the chart, we can see that ETH’s major lows are highly correlated with Bitcoin. However, before the start of a major ETH bull run, we can see that the correlation between BTC and ETH is minimal. In March 2024, the six-month correlation between Bitcoin and Ethereum hit a low of around 70%. Symmetrically, this certainly indicates that a strong bull run for ETH is likely on the way. However, studying the correlation between the two assets cannot effectively determine Ethereum's expected high price.
Despite this, we can see that the correlation between the two assets generally remains high. The correlation is over 80% in most cases, which is significant.
Towards $6,000?
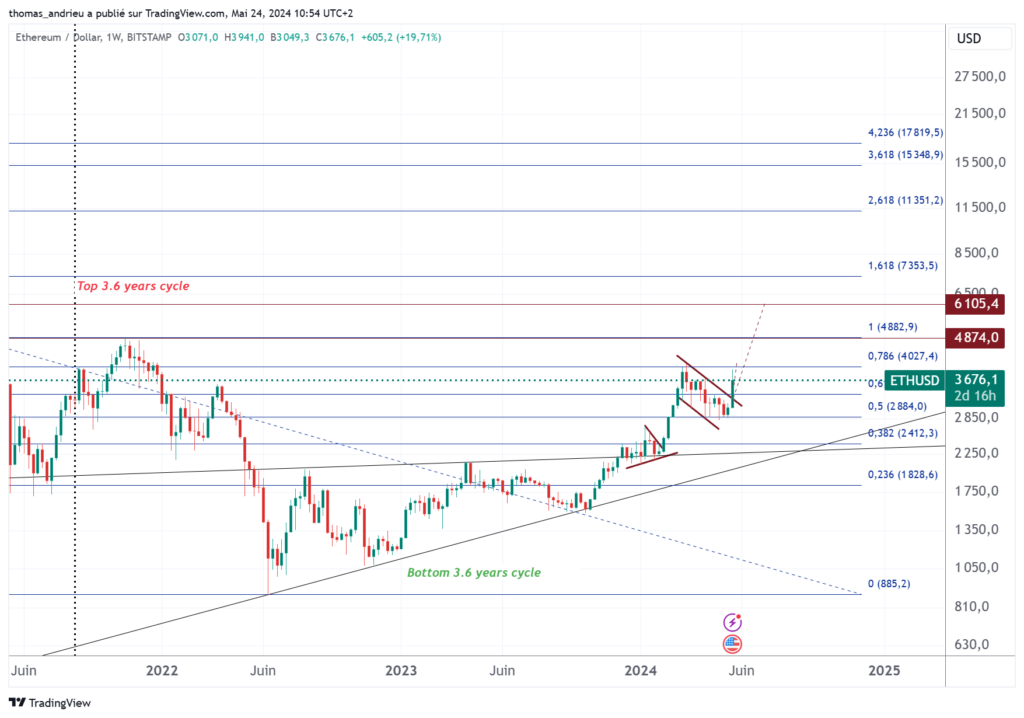
Technical analysis of Ethereum price can provide an additional factor: in fact, it turns out that the March/April 2024 consolidation does not undermine the bullish trend that began since 2023. Conversely, the recent bullish breakout could set an initial target (almost reached) towards the recent peak around $4,000.


And as we have highlighted, taking into account its correlation with Bitcoin, it would be coherent to reach the historic high of $4,800. If this theoretical bullish move continues, the next extension target of the consolidation pattern (flag, logarithmic scale) is near $6,000. This level does not seem impossible, either graphically or statistically. Conversely, continued difficulty in surpassing the recent highs or an extended decline below $3,000 could signal a break from the bullish trend.
We also said that, as with Bitcoin, the timing of this move is good. However, we believe the continued upward trend will be less well-founded than the gains in 2023 and early 2024. This inevitably leads to increased attention being paid to indicators of market strength.
Conclusion
The approval of the Ethereum ETF appears to have triggered a break in the consolidation since March, thus continuing Ethereum’s upward trend.
- Due to growing demand for ETFs and a rebound in Bitcoin prices.
- From a fractal perspective, bullish strength has weakened, but the price bounce back looks set to continue into April/May.
- Additionally, market timing and cyclicality still appear to be important. So far, a certain symmetry has been maintained between the current bull market and previous bull markets. Thus, upward trends are accompanied by structural cycles in the market.
- It remains correlated with Bitcoin despite the lack of correlation in March 2024. This signal indicates that the ETH bull run is likely to continue in line with Bitcoin.
- Finally, technical analysis clearly indicates the possibility of continuation. Therefore, the bull market will likely reach previous peaks and targets towards the historic peak. If the bullish strength is sustained, some long-term targets could be around $6,000 and even higher.
Make the most of your Cointribune experience with our “Read to Earn” program. Earn points for every article you read and get access to exclusive rewards. Sign up now and start earning rewards.
Click here to join Read to Earn and turn your crypto passion into rewards!
As the author of various books and the finance and economics editor of many websites, I have a true passion for analyzing and researching markets and economies.
Disclaimer
The views, thoughts and opinions expressed in this article are those of the author and should not be taken as investment advice. Please conduct your own research before making any investment decisions.

