

This research paper demonstrates the strength of the Purchasing Managers' Index™ (PMI®) in tracking changes in consumer price inflation in the euro area and the United States. PMI data has significant advantages over other indicators due to its timeliness and lack of revision, and our empirical analysis shows that PMI-based models are widely used when predicting changes in inflation. We found that it consistently outperformed benchmarks.
introduction
Nowcasting is a type of forecasting that primarily focuses on estimating current (or very near past or future) economic conditions and is used by economists in predicting short-term changes in key macroeconomic variables. , remains popular among policymakers and investors. Most commonly, this framework is often used to predict changes in gross domestic product (GDP). However, the dramatic changes in consumer prices observed since the start of the COVID-19 pandemic represent a clear turnaround from the benign inflationary environment of the 2010s and are There is growing interest in using nowcasting tools to understand inflation trends. Background to central bank decision-making focused on price stability.
Nowcasting techniques are particularly favored because they provide an almost “real-time” understanding of current price trends. This is an important feature for decision makers. By using the latest available data, we can better understand future developments ahead of the release of official price statistics and optimize policy and investment decisions.
An important source of timely, unrevised information used in nowcasting applications is PMI data. These monthly indices are typically based on survey responses from a representative panel of business executives from across the manufacturing and private service economies. Each month, panelists provide information on a variety of metrics including production, new orders, employment, prices, supply chain stress, and inventory. Surveys are typically conducted in the middle of the month and published either on the first business day (manufacturing) or the third business day (services and combined, combined for both sectors) of each month after the base period. In addition to the final data, “flash” data is also released for some economies, including the eurozone, France, Germany and the United States. These numbers are based on approximately 85%-90% of the final sample and will be available approximately 10 days prior to final release, significantly earlier than official statistics*.
PMI vs. CPI
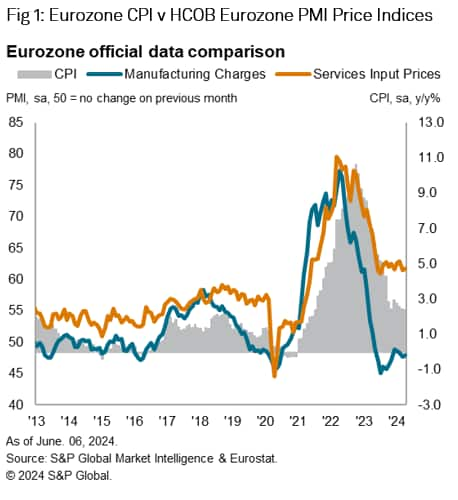
Figure 1 shows the annual change in Eurostat's Eurozone Consumer Price Index (CPI) and two S&P Global Market Intelligence price indexes: the Eurozone Manufacturing PMI Output Price Index and the Eurozone Services PMI Input Price Index** It shows the visual relationship between Although PMI committee members are asked to compare variables from mid-month to mid-month, we still compare each PMI to the year-over-year change in consumer prices, the most common measure used by economists. Track the series.
Both show a good relationship with the official data series. For manufacturing, the correlation coefficient since 2013 is 62%. A whopping 93% for service. This difference is perhaps expected given the respective positions of the manufacturing sectors in the supply chain, with manufacturing data tending to 'lead' both the services and official consumer price series. Supported by observations. In fact, the correlation coefficient for manufacturing prices is almost the same (92%) as the correlation coefficient for service input prices when applying a 7-month lead.
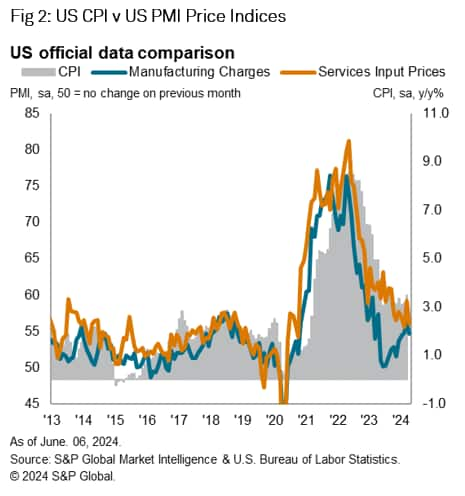
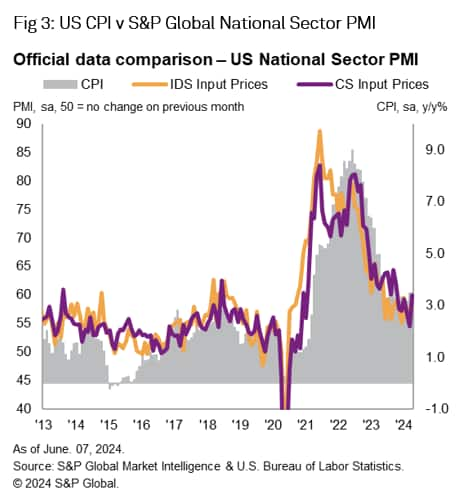
A similar trend is observed in comparable data for the US, although the 'leading' in manufacturing PMI data is less evident than in the euro area (see Figure 2). Correlation coefficients with official data are high: 80% for the Manufacturing Output Price Index and 81% for the Service Input Price Index.
Inflation nowcasting
Given the strong relationship that exists between surveys and official data, as well as the desirable characteristics of timeliness and lack of revisions, the PMI is currently the leading predictor of consumer price inflation statistics in both the euro area and the United States. This is a candidate. Therefore, through a simple nowcasting exercise, we would like to highlight the short-term predictive power of the PMI in nowcasting year-on-year changes in consumer prices.
We start with a benchmark model based on a simple autoregressive (AR) specification, as shown in Equation 1.

Here, annual consumer price inflation (CPI_t) in period t is simply a linear function of a lagged version of itself (CPI_(t-1)). Such models are usually seen as a baseline for predicting changes in inflation and are generally considered to be very useful in terms of predictive performance.
However, we added the PMI variable to the baseline model.
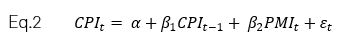
Consumer price inflation is currently viewed as a linear function of lagged inflation and the current period measurement of the PMI variable.
These parsimonious models can be easily estimated by ordinary least squares (OLS) regression. We leverage this widely used technique to perform an out-of-sample nowcasting exercise for the period January 2020 to May 2024. Both Eurozone and US CPI data are converted to year-over-year series, although PMI price data is provided in the usual diffusion index format. Note that PMI data can take on different definitions, such as input price index or output price index for manufacturing industries, or their equivalents for the services sector. Since different forms of the PMI price index occupy the positions of the variable PMI_t, this means running four different versions of Equation 2 (thus producing four separate nowcasts).
result
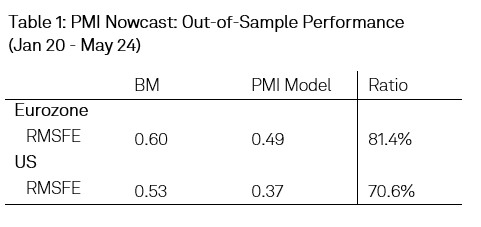
To evaluate the nowcasting performance of each PMI index, we use the root mean square forecast error (RMSFE) relative to the forecast error (RMSFE) of the benchmark model (denoted as “BM” as defined in Equation 1). For the RMSFE ratio (PMI model to benchmark), a reading below 100% indicates that the PMI data is improving the benchmark model (i.e., the error is relatively low). Values close to zero are considered the most positive.
We estimate the “center” nowcast for comparison to the benchmark by taking a simple weighted average of the nowcasts of the four individual models produced by Equation 2. Such approaches have a long and positive history in academic literature and typically perform well in long-term nowcasting exercises. duration, at least consistent with more econometrically sophisticated specifications (such as dynamic factor models).
The results are shown in Table 1. These results show that models including PMI data outperform benchmark models in both the euro area and the US, providing clear evidence that PMI price data adds significant value to nowcasting exercises. I am. This is especially true in the United States. Compared to the benchmark model, the PMI-driven “central” nowcast improves the predictive ability of the BM by about 29%. For the euro area, on the other hand, the PMI model shows a significant but more modest 19% increase relative to the benchmark***.
National sector data
In addition to the main PMI price index, more detailed sector data is available from S&P Global in some regions. For these PMI products, S&P Global Market Intelligence maps individual company responses to industry sectors according to Standard Industrial Classification (SIC) codes. Indices are available across a wide range of sectors, including basic materials, consumer goods, consumer services, financials, healthcare, industrials, and technology.
In the case of the United States, correlation analysis shows that the sectors of Industrial Services PMI Input Prices, Consumer Services PMI Input Prices, Industrial Services PMI Output Prices, and Technology PMI Output Prices are strongly related to annual changes in the Consumer Price Index. It turns out that. Use these indices to perform the same nowcasting exercise as before. Table 2 shows the individual performance of each company along with the main US PMI price index.
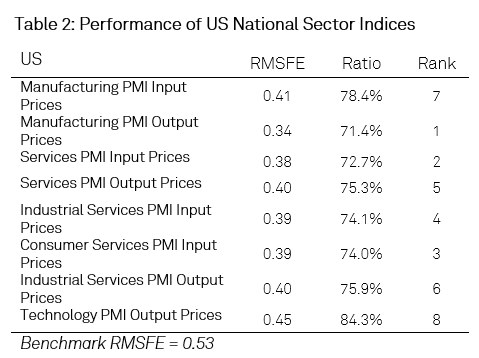
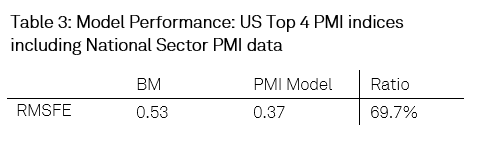
Although all individual models improve over the benchmark model, consumer service input prices and industrial service input prices perform particularly well in predicting inflation (ranked third and fourth in terms of predictive power). ranked). These indices are combined with the broader Manufacturing PMI Output Prices and Services PMI Input Prices indices, i.e. using the top four most “powerful” indices to create a new equally weighted PMI central nowcast. Created. As expected, the national sector PMI data is even more valuable, outperforming the benchmark by 30% outside the sample period (see Table 3). Notably, this is a slightly better performance than using the headline PMI price index alone, suggesting that there is some added value in using national sector PMI data in nowcasting applications.
summary
PMI data is timely and each price index is closely correlated with year-on-year changes in consumer prices in the euro area and the United States. These relationships allow us to predict inflation more accurately than benchmark forecasting models, which are difficult to beat. Additionally, the availability of national sector PMI data ensures that the PMI dataset has sufficient scope, depth, and options, making it an essential tool for anyone wishing to forecast changes in the official consumer price index in a timely manner. It becomes.
*The PMI series produced by S&P Global Market Intelligence is also geographically broad, currently covering more than 40 countries.
**Manufacturing PMI Output Price Index and Services PMI Input Price Index were chosen because they have the most visual and statistical relationship with official consumer price inflation.
***Of the four PMI price indexes included in the “core” nowcast, the Manufacturing Output Price Index and the Services Input Price Index performed best when predictive power was taken into account. This applies to both the euro area and the United States.
Click here for the full report
Paul Smith, Economics Director, S&P Global Market Intelligence
Phone number: +44 1491 461 038
Email: paul.smith@spglobal.com
Sian Jones, Principal Economist, S&P Global Market Intelligence
Phone: +44 1491 461 017
Email: sian.jones@ihsmarkit.com
Eleanor Dennison, Economist, S&P Global Market Intelligence
Phone: +44 1344 328 197
Email: eleanor.dennison@spglobal.com
© 2024, S&P Global. Unauthorized reproduction is prohibited. Reproduction in whole or in part without permission is prohibited.
Purchasing Managers Index™ (PMI)®) Data is compiled by S&P Global for more than 40 economies around the world. Monthly data comes from a survey of senior executives at private companies and is available by subscription only. The PMI dataset includes headline numbers that indicate the overall health of the economy and sub-indices that provide insight into other key economic factors such as GDP, inflation, exports, capacity utilization, employment, and inventories. Masu. PMI data is used by financial and corporate professionals to better understand where the economy and markets are heading and to uncover opportunities.
Learn more about PMI data
Request a demo
This article was published by S&P Global Market Intelligence and not by S&P Global Ratings, an independently managed division of S&P Global.