- According to RSI, ETH continues to maintain a strong bullish trend, at around 56.
- The price decreased by 0.73% in the last trade.
Ethereum [ETH] Although there has been a slight decline over the past 24 hours, technical indicators point to a possible short-term bullish shift.
Despite the recent decline, net flows on the company's exchanges show that outflows are predominant, with more ETH being withdrawn from exchanges than deposits, indicating potential This indicates a decline in buying interest and selling pressure.
Ethereum price trends and technical indicators
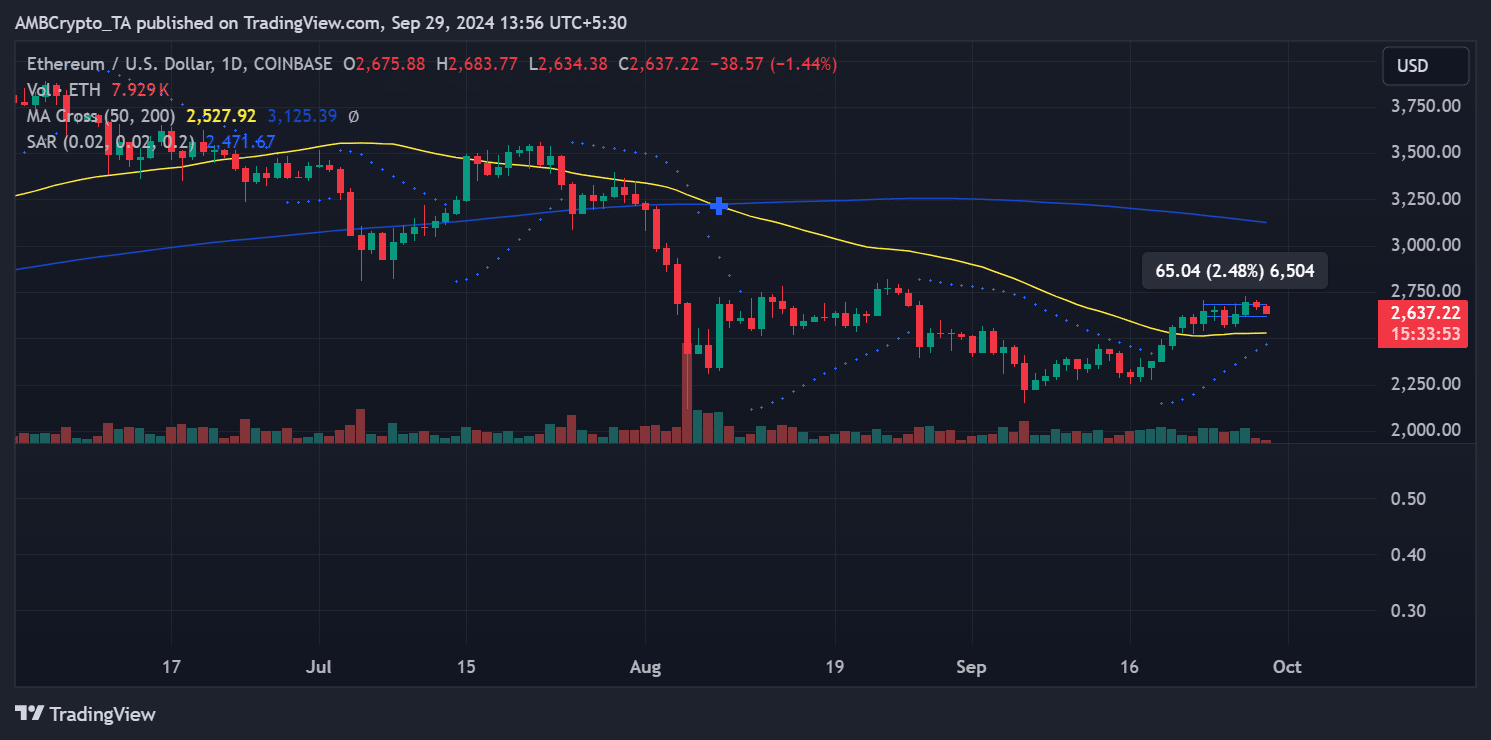
Ethereum is trading at $2,637.22 at the time of writing, reflecting a short-term decline of 1.44%. On the daily chart, the 50-day moving average (yellow) is at $2,527.92, while the 200-day moving average (blue) is still high at $3,125.39.
ETH trading above its 50-day moving average indicates near-term bullish momentum. However, it remains well below its 200-day moving average, suggesting the broader long-term trend remains bearish.


Source: TradingView
The Parabolic SAR indicator also confirms this near-term bullish outlook with a dot placed below the price. This indicates that the current uptrend remains intact and buyers are still in control of the market at the moment.
Although Ethereum is showing signs of strength in the short term, it is facing strong resistance from its 200-day moving average, which could prevent a long-term breakout.
More Ethereum holders benefiting
Despite the recent decline, Ethereum's rally earlier this week had a significant impact on holders' profitability. According to data from the Global In/Out of the Money chart, the share of profits for ETH holders increased from 59% to 68%.
This means that over 83 million addresses are currently holding and profiting from ETH.
Meanwhile, 29.47% of addresses (equivalent to 36.17 million) are currently “out of the money,” or in a loss-making state. Approximately 2.38%, or 2.93 million addresses, have reached the break-even point.
Exchange netflow: outflows dominate
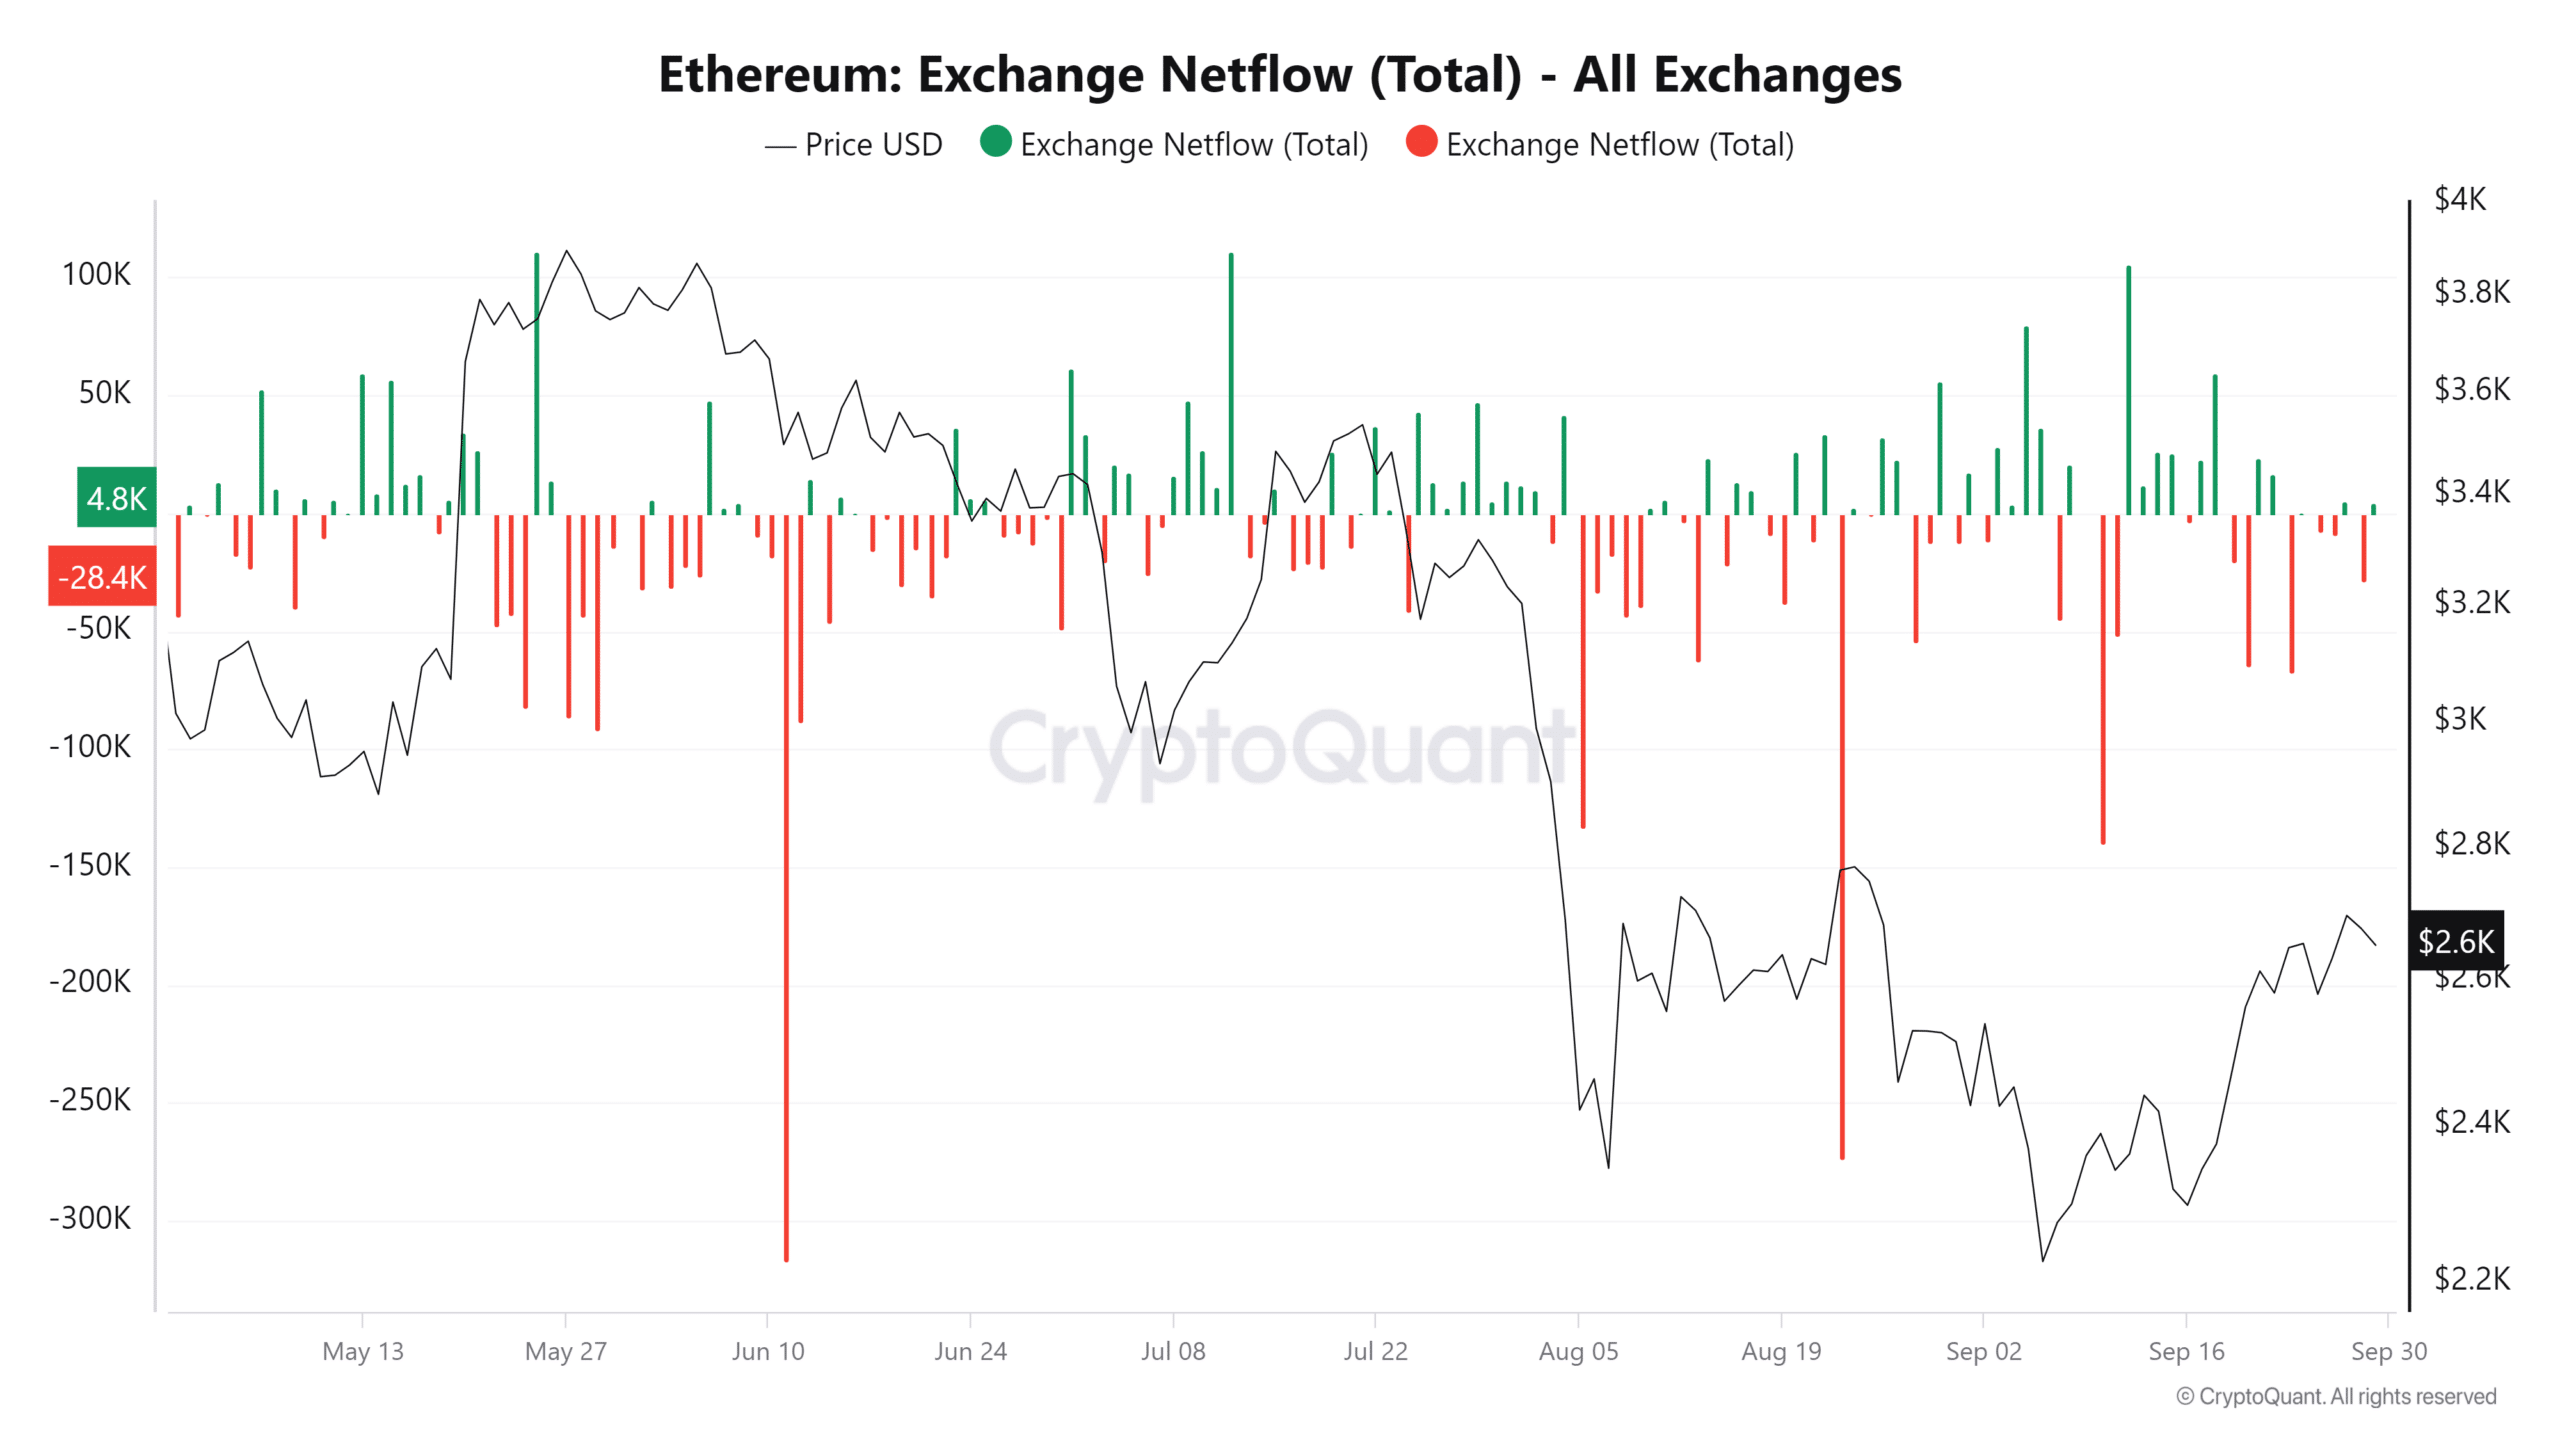
Net flows on Ethereum exchanges have fluctuated between inflows and outflows throughout the past week. However, the overall trend shows that the amount of ETH leaving the exchange is increasing, indicating that there are more outflows than inflows.
This net negative flow is significant, especially considering the selling events by retail and institutional investors earlier this week.


Source: CryptoQuant
At the end of the last trading session, net ETH flows were more than 28,000 ETH negative, highlighting the dominance of outflows. This trend of ETH moving off exchanges suggests that investors may be holding on to their coins, reducing the likelihood of an immediate sale.
Read Ethereum (ETH) price prediction for 2024-25
conclusion
Ethereum is currently trading above its 50-day moving average and is riding out a mixed market with short-term bullish momentum as exchange outflows increase.
However, the significant resistance posed by the 200-day moving average remains an obstacle to the long-term bullish trend.
Moreover, despite the recent price decline, the increase in holders making profits shows renewed confidence among investors.

