Ethereum (ETH) price is currently trading above $3,650, with today's Ethereum (ETH) price reflecting a notable upward trajectory. This move is part of a broader trend as the coin recovers from its previous lows of $3,453, a key support level that was tested in the early hours of trading. Once the market woke up, ETH's value skyrocketed, reaching a peak of around $3,680, before stabilizing slightly, but still at around $3,650.

This price increase is accompanied by an increase in trading volume, indicating strong interest in Ethereum as it gradually approaches critical resistance levels. The broader cryptocurrency market is trending upwards, with Bitcoin leading the way and altcoins following suit.
This upward trajectory comes after a massive liquidation of over $100 million of short interest, indicating strong buying momentum in the market. Ethereum's valuation reflects this growth, with its market capitalization soaring to over $437 billion. Trading volumes surged 57%, indicating increased activity among traders.
Despite short-term resistance, technicals favor buyers
ETH price analysis shows Ethereum’s resilience despite the recent decline seen in mid-March. Sellers have the advantage in the short term, but a solid break above the current decline could put the reins back completely in the hands of the bulls.

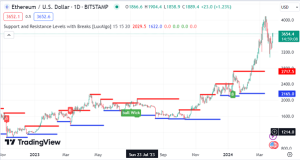
On the daily ETH/USD chart, Ethereum shows that ETH is trading in a bullish trend. ETH broke through the major resistance level at $2,717.5 and turned into a potential support zone. Current price stability above this level indicates a solid bullish stance. The formation of a “bullish core” indicates buying interest on the downside, further reinforcing the strength of the uptrend.
Ethereum's rally has been characterized by a series of rising highs and rising lows, which is a classic sign of a sustained bullish trend. If this pattern continues, we believe the next key resistance level is around $3649.1, and if broken, the price could explore higher levels towards the $4000 threshold.
ETH/USD 4-hour chart analysis reveals potential bullish pattern

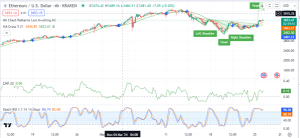
The ETH/USD pair on the 4-hour chart appears to be forming an inverted head-and-shoulders pattern, a typical bullish reversal setup, indicating a possible uptrend. Currently, Ethereum price is trading above and below the $3,650.50 mark, with the right shoulder of the pattern just completing.
The Stochastic RSI shows strong momentum rising sharply into overbought territory, which could signal a short-term pullback before further upside. Chaikin Money Flow (CMF) is above the zero line, suggesting buying pressure is outweighing selling pressure, reinforcing the bullish scenario.
If Ethereum can maintain this momentum and break through the neckline near $3,655, the pattern-implied objective could push the price towards the $4,000 area if the market maintains its current trajectory. However, an overbought condition on the Stochastic RSI could lead to a temporary retracement, which should be taken into consideration by those looking for entry points in anticipation of a potential uptrend.
The current market sentiment surrounding Ethereum is cautiously optimistic, as technical analysts including Captain Fibig support the possibility of ETH rising to the $4,000 price level. This occurs after a bullish pattern on the 4-hour candlestick chart indicating a possible bullish breakout.
$FET Bullish flag breakout on 4 hour TF chart..!!
In the short term, we can expect a bullish rally of 50-60% 📈#cipher #FET #FETUSDT pic.twitter.com/UAx09LQ5Vv
— Captain Faibik (@CryptoFaibik) March 26, 2024
The particular pattern identified is a descending expansion wedge, which is usually a bullish signal suggesting a reversal from a previous consolidation trend. Ethereum has recently seen a 4.3% increase in price and is currently trading above the $3,600 mark, requiring a rise of about $400 to clear the $4,000 threshold and return to its monthly high of $4,067. expectations are being reignited.

