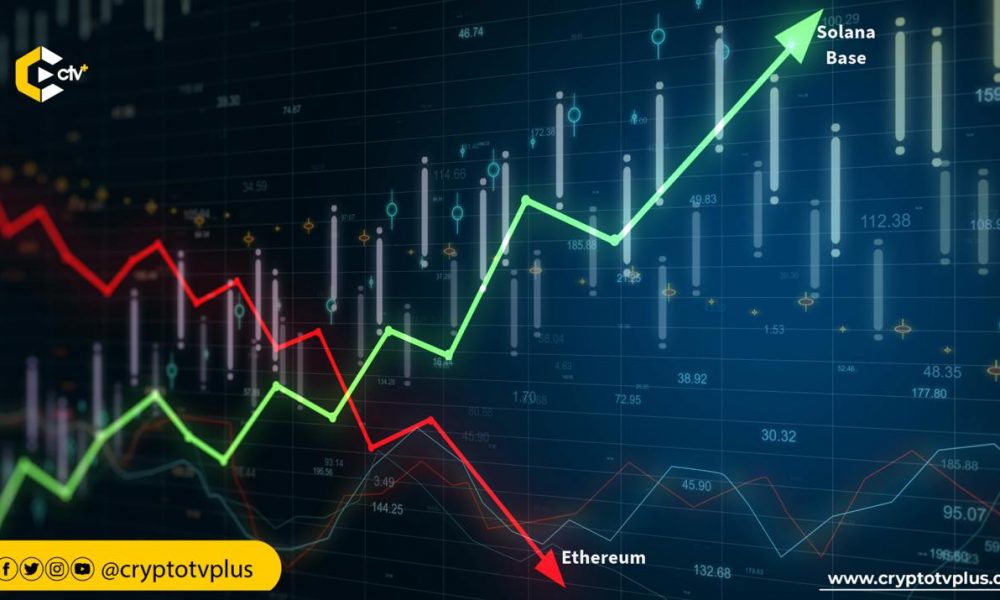
Exchanges play an important role in the crypto space, allowing users to trade crypto assets. Ethereum hosts the most decentralized exchanges (DEXs), but a new report appears to be shaking its dominance.
According to a report by CoinGecko, Ethereum-based DEXs declined in the third quarter of 2024. Market share fell below 40%, and trading volume fell nearly 20% from the previous quarter, reaching $130.5 billion by the end of September.
DEXs allow users to trade cryptocurrencies directly with each other, bypassing traditional intermediaries such as centralized exchanges. This setup allows users to connect their wallets to DEXs and trade directly, allowing them to maintain control of their funds. Examples of Ethereum DEXs include Uniswap and SushiSwap.
According to the report, Base and Solana DEXs gained momentum and gained more market share while Ethereum DEXs declined. Solana in particular has seen an increase in activity due to the popularity of meme coins. By the end of September, Solana accounted for 22% of the market, with transaction value of $21.5 billion.
During this period, Base achieved significant growth despite the overall weak performance of the crypto market. Trading volume surged more than 31%, allowing it to outperform Arbitrum. By the end of September, Base controlled 13% of the market with a trading volume of $12.3 billion.
Meanwhile, Tron has entered the top 10 chains for DEX trading, replacing Blast, which suffered a significant drop in trading volume. Tron has leveraged a new tool called SunPump to make it easier for users to create meme coins. This innovation led to a sharp increase in trading activity, with Tron gaining 2% market share in September with $1.7 billion in trades.
Increase in transactions on Ethereum Layer 2
Coingecko noted that the total number of transactions across the top 10 Ethereum Layer 2 (L2) networks increased steadily in the third quarter. L2 solutions are technologies built on layer 1 blockchains like Ethereum. We aim to improve scalability, speed up transactions, and reduce costs.
L2 addresses scalability by processing transactions off-chain, reducing the load on the main blockchain network. This approach makes blockchain applications more accessible to users by reducing congestion, speeding up transactions, and reducing fees.
Please also read: Read our detailed analysis of centralized exchange market trends in Q3 2024.
The report revealed that these networks process nearly 10 million transactions each day, compared to the main Ethereum network, which processes approximately 1 million transactions each day. Among L2, Base has seen a significant increase in activity since the beginning of the year.
Base emerged as the busiest L2, accounting for 42.5% of all transactions in Q3. Arbitrum followed as the second most active network, processing 18.9% of transactions. In third place was Blast, which accounted for 8.1% of transactions during the same period.
In August, Manta Pacific Network saw a significant increase in transactions, primarily driven by Taman, a fully on-chain mini-app available on Telegram. However, once the app's launch campaign ended, activity on Manta Pacific decreased noticeably.
Layer 2 (L2) solutions are critical to Web3's growth as they address the scalability and cost challenges faced by Layer 1 blockchains. With the expansion of Web3, more decentralized applications (dApps) are being developed, resulting in increased transaction volumes that are difficult for layer 1 blockchains to manage efficiently.
L2 solutions address this issue by processing transactions off-chain, thereby significantly increasing transaction speeds, reducing fees, and increasing overall network capacity.

