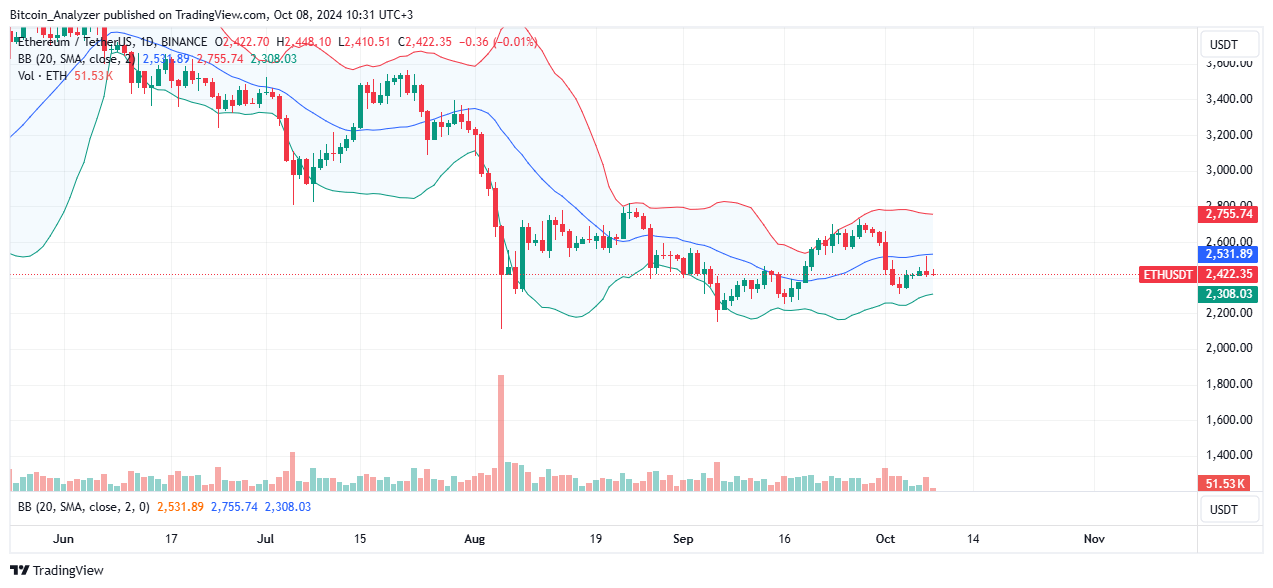
Looking at the price movement over the past few weeks, Ethereum has been flat in an overall bearish market. From a top-down approach, Ethereum is falling, coinciding with the July 2024 bearish breakout formation. There are concerns about a climactic crash towards $2,100 in early August. It could become confirmed if the bulls are unable to sustain the upward momentum. Technically, the immediate support and resistance levels to watch are $2,100 and $2,800. With the bears in control and coinciding with the July candlestick, the possibility of ETH falling below the August low cannot be ignored.
Although traders are confident, buyers are yet to easily break through the local resistance levels. The coin is up 12% from its September lows, but remains below $2,800. Meanwhile, support is at $2,300 and $2,100. It fell 8% last week as buyers looked to erase weaknesses. Still, what's encouraging is that trading volume has grown to over $16 billion.

Ethereum traders are monitoring the following trending news:
- Last week, all U.S. Spot Ethereum ETFs recorded outflows. Most are from Grayscale ETHE, which is currently being discontinued. Despite customers accumulating these stocks, net flows remain negative by more than $30 million from the previous week due to outflows from ETHE.
- Looking at the formation of the weekly chart, the uptrend is maintained. Despite a series of low prices, there are opportunities for buyers. However, the situation changes if it breaks below local support between $1,800 and $2,100.
Ethereum price analysis
ETH/USD It's down at press time.
Still, as long as resistance remains at $2,800, the path of least resistance is southward.
Therefore, sellers may offer entries targeting $2,100 and $1,800, respectively.
This sell-off could further accelerate if the price breaks below the $2,300 support.
Conversely, if Ethereum crosses $2,800 in an uptrend, the coin will skyrocket to $3,000 and then $3,500.

