- Bitcoin price fell below the key support level of $62,000 following Tuesday's plunge due to Iran's attack on Israel.
- U.S. spot ETFs recorded outflows of $240.6 million on Tuesday, the biggest single-day decline since September 3.
- CryptoQuant’s weekly report suggests that Bitcoin could rise in the coming days, but demand needs to increase.
Bitcoin (BTC) rebounded slightly on Wednesday, trading above $61,000 after Tuesday's decline due to the escalating conflict between Israel and Iran. The decline left BTC trading below $61,000, wiping over $500 million from the crypto market. U.S. spot ETF data recorded outflows of more than $240 million, the biggest single-day decline in nearly a month, suggesting a decline in institutional demand.
Bitcoin plummets as tensions between Iran and Israel escalate
Global stocks and risk assets such as Bitcoin experienced declines on Tuesday after Iran fired a missile at Israel, sparking fear and uncertainty in markets as Israel could respond to the attack in the coming days. Certainty, doubt (FUD) arose. The missile attack was a response to a series of Israeli attacks on Lebanon in the past few weeks.
The event sent Bitcoin and the US S&P 500 index down 3.98% and 0.84%, respectively, as investors turned to safe-haven assets such as gold, while gold rose more than 1% on the day.
According to data from CoinGlass, Bitcoin's price decline triggered a wave of liquidations across the crypto market, resulting in total liquidations of more than $500 million, and more than $140 million in BTC in particular.

Total liquidation graph

Bitcoin liquidation chart
U.S. Bitcoin spot exchange-traded fund (ETF) data recorded $240.6 million in outflows on Tuesday, the biggest single-day decline since September 3 and halting inflows for eight consecutive days. Studying ETF flow data can help you observe institutional investor sentiment towards Bitcoin. If outflows of this magnitude continue, demand for Bitcoin will decrease, leading to a fall in the price.

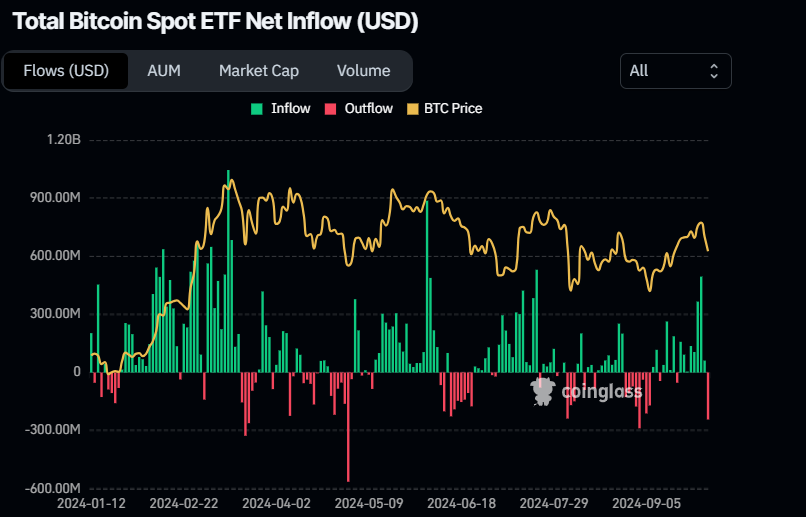
Bitcoin Spot ETF Net Inflow Chart
CryptoQuant expects Bitcoin price to reach $85,000-$100,000 if demand increases
CryptoQuant’s weekly report highlights that Bitcoin may rise in the coming days, but demand still needs to recover.
“Bitcoin is entering a period of strong seasonal performance,” the report said, noting that BTC has generally performed well in the fourth quarter when it is in a bull cycle, especially during halvings like 2024. It cites the fact that it was shown.
The graph below shows that during past Bitcoin halvings (2012, 2016, and 2020), BTC price increased by 9%, 59%, and 171%, respectively. Bitcoin price performance in 2024 was similar to its 2016 and 2020 price performance through September.
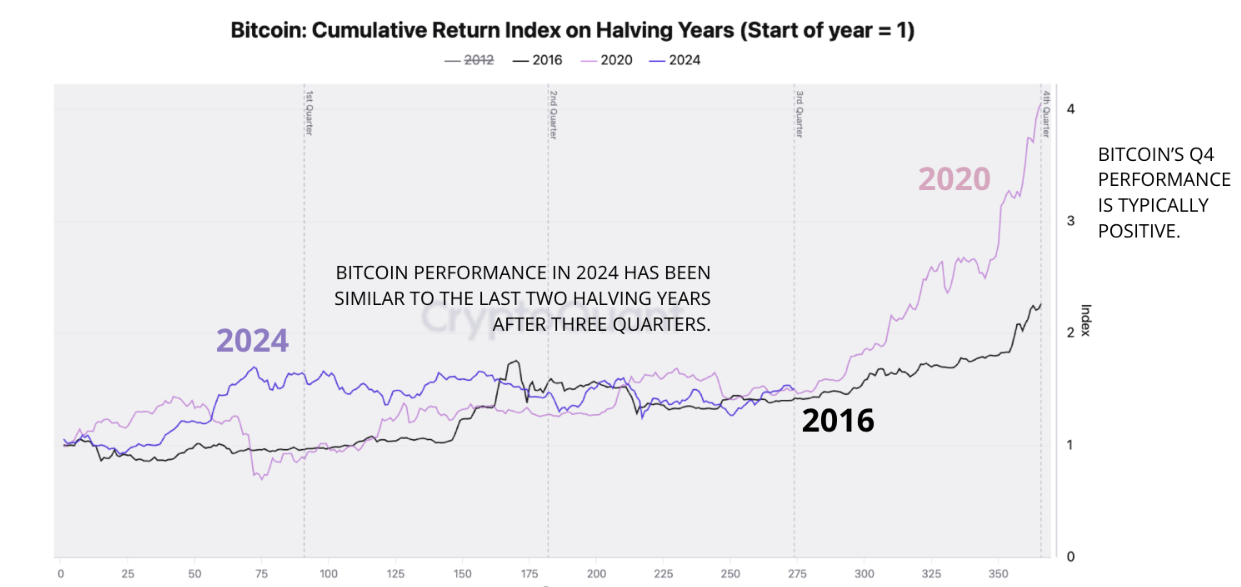
Bitcoin Cumulative Return Index Chart
The report also highlights that Bitcoin's apparent demand will need to grow at a faster pace to maintain its high prices in the fourth quarter, although it seems to have stopped falling.
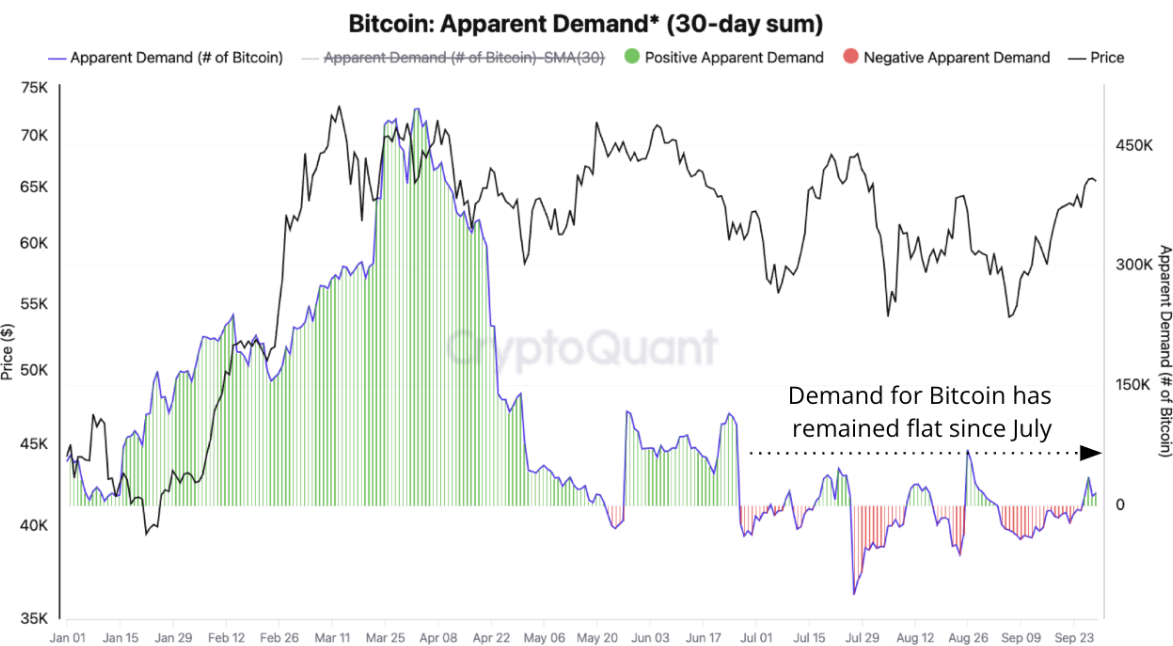
Bitcoin apparent demand chart
Analysts at CryptoQuant said institutional demand through U.S. exchange-traded funds (ETFs) will be key to further price gains, noting that inflows are starting to pick up again.
If ETF demand continues to accelerate, prices could rise in the final quarter of 2024, analysts say, with Bitcoin targeting $85,000 to $100,000 in the fourth quarter. I expect it to be possible.
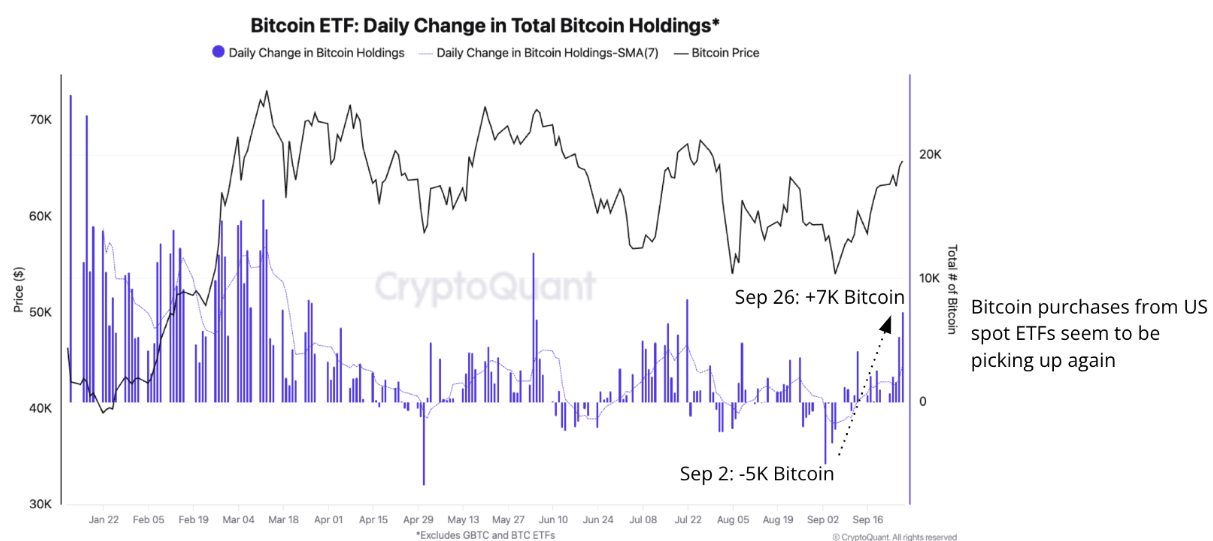
Bitcoin ETF Chart
The graph below explains that levels represent the upper and maximum levels of a trader's on-chain realized price range, quantifying the price level at which short-term Bitcoin traders typically start taking profits after a price rise. .
Historically, the upper band (orange dotted line) has been the price resistance for this bull market and currently stands at around $86,000. The maximum band, currently at around $106,000 (red dashed line), became the ultimate price resistance in March when Bitcoin reached its most recent all-time high of $73,600.
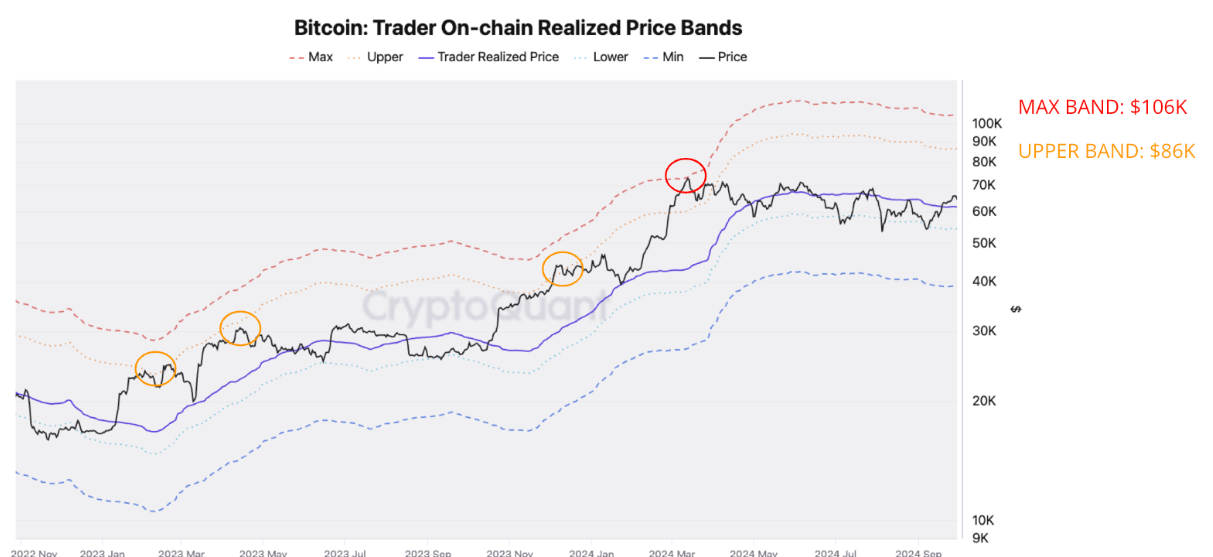
Price range chart realized by Bitcoin trader
Technical analysis: BTC is showing signs of weakness
Bitcoin price was rejected from the psychologically important $66,000 level on Saturday and fell more than 7% over the next three days, ending below the $62,000 support level. It has recovered slightly as of Wednesday, trading around $61,000, but has been rejected at around $62,000.
If the $62,000 level holds as resistance and Bitcoin closes below the 200-day exponential moving average (EMA) of $59,895, it will extend the decline to retest the September 17 low of $57,610. There is a possibility.
The Moving Average Convergence Divergence (MACD) indicator further supports Bitcoin's decline, pointing to a bearish crossover on Tuesday. A sell signal has been issued because the MACD line (blue line) has fallen below the signal line (yellow line). Also, a red histogram bar appears below the neutral zero, suggesting that Bitcoin price may fall.
Additionally, the relative strength index on the daily chart plummeted to 47, below the neutral level of 50. A cross below the neutral level generally indicates bearish momentum is gaining momentum.
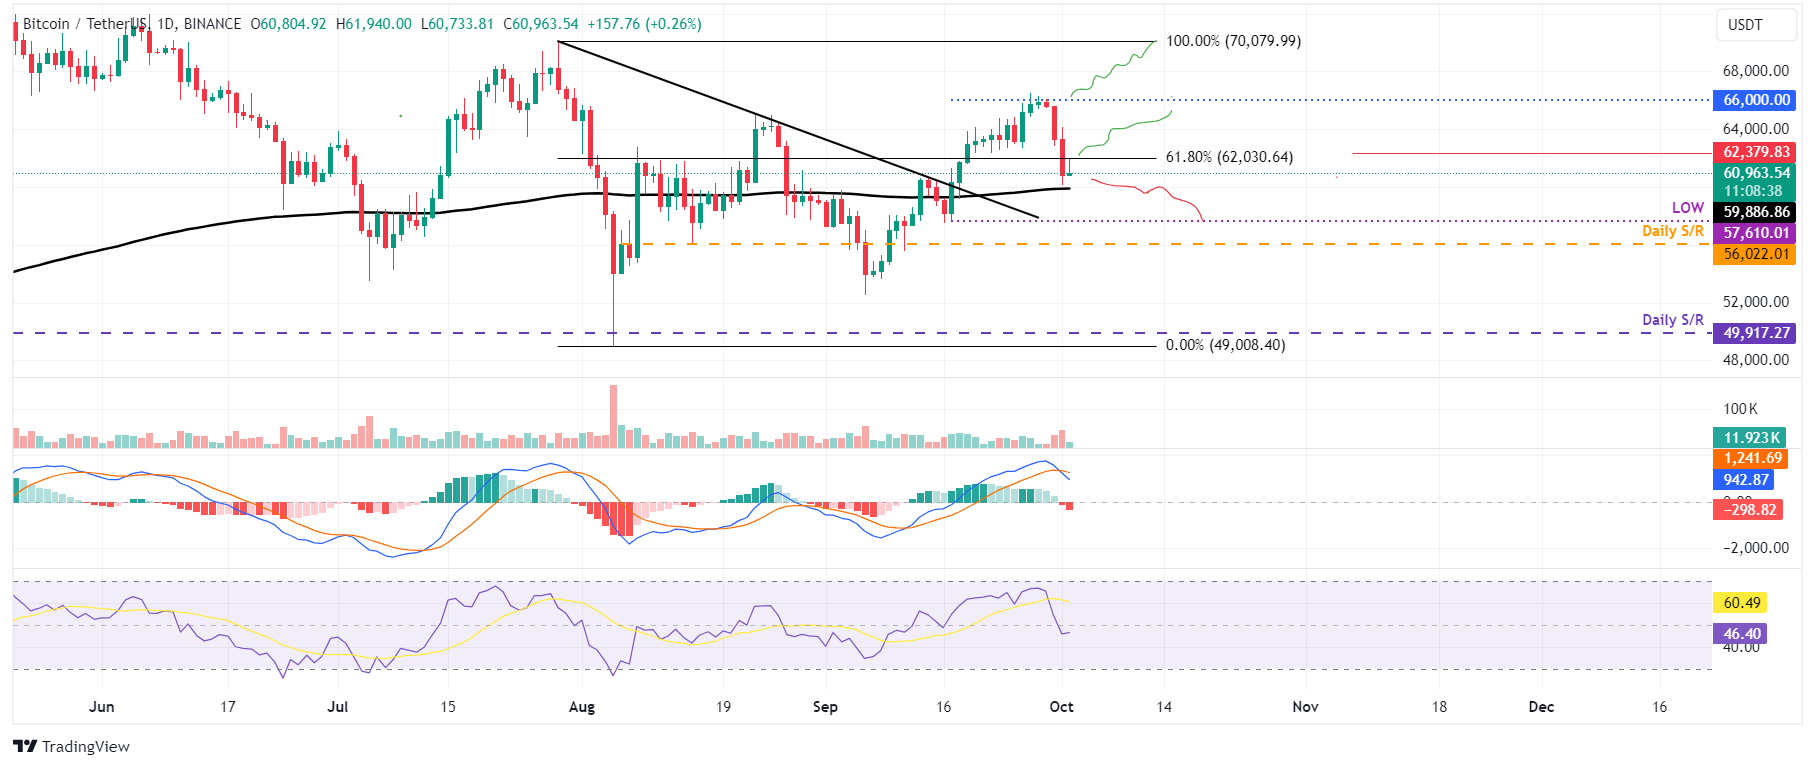
BTC/USDT daily chart
However, if BTC rises and closes above the $62,000 level, it could resume its rally and retest the next resistance level at $66,000.
Frequently asked questions about Bitcoin, altcoins, and stablecoins
Bitcoin is the largest cryptocurrency by market capitalization and is a virtual currency designed to function as money. This form of payment is not controlled by any particular person, group, or entity and eliminates the need for third parties to participate during financial transactions.
An altcoin is any cryptocurrency other than Bitcoin, but some consider Ethereum to be a non-altcoin because it is these two cryptocurrencies that forks occur. If this is true, Litecoin would be the first altcoin to fork from the Bitcoin protocol and thus be an “improved” version of it.
A stablecoin is a cryptocurrency that is designed to have a stable price, and its value is backed by the reserves of the asset it represents. To achieve this, the value of a stablecoin is pegged to a commodity or financial instrument, such as the US dollar (USD), and its supply is regulated by an algorithm or demand. The main purpose of stablecoins is to provide an on/off ramp for investors who wish to trade and invest in cryptocurrencies. Stablecoins also allow investors to store value, as cryptocurrencies are generally volatile.
Bitcoin dominance is the ratio of Bitcoin's market capitalization to the market capitalization of all cryptocurrencies combined. This clearly shows the interest in Bitcoin among investors. BTC's dominance typically occurs around bull markets, where investors turn to relatively stable, high-market-cap cryptocurrencies like Bitcoin. Decreasing BTC dominance usually means investors are moving their capital and profits to altcoins in search of higher returns, which usually causes an explosive rally in altcoins.

