- Bitcoin broke out and closed above the 100-day EMA near $60,781, turning attention to further upside.
- Ethereum price is approaching the key resistance level of $2,461 and a close above this will suggest bullish activity.
- Ripple price has bounced off the 100-day EMA at $0.554, indicating a continuation of the uptrend.
Bitcoin (BTC) and Ripple (XRP) are eyeing upside as they break through resistance barriers and find support around them, while Ethereum (ETH) is showing signs of recovery as it nears a key resistance level, suggesting that a successful breakout could be in the cards for an upside rally.
Bitcoin surpasses key resistance level and aims for $65,000 closing price
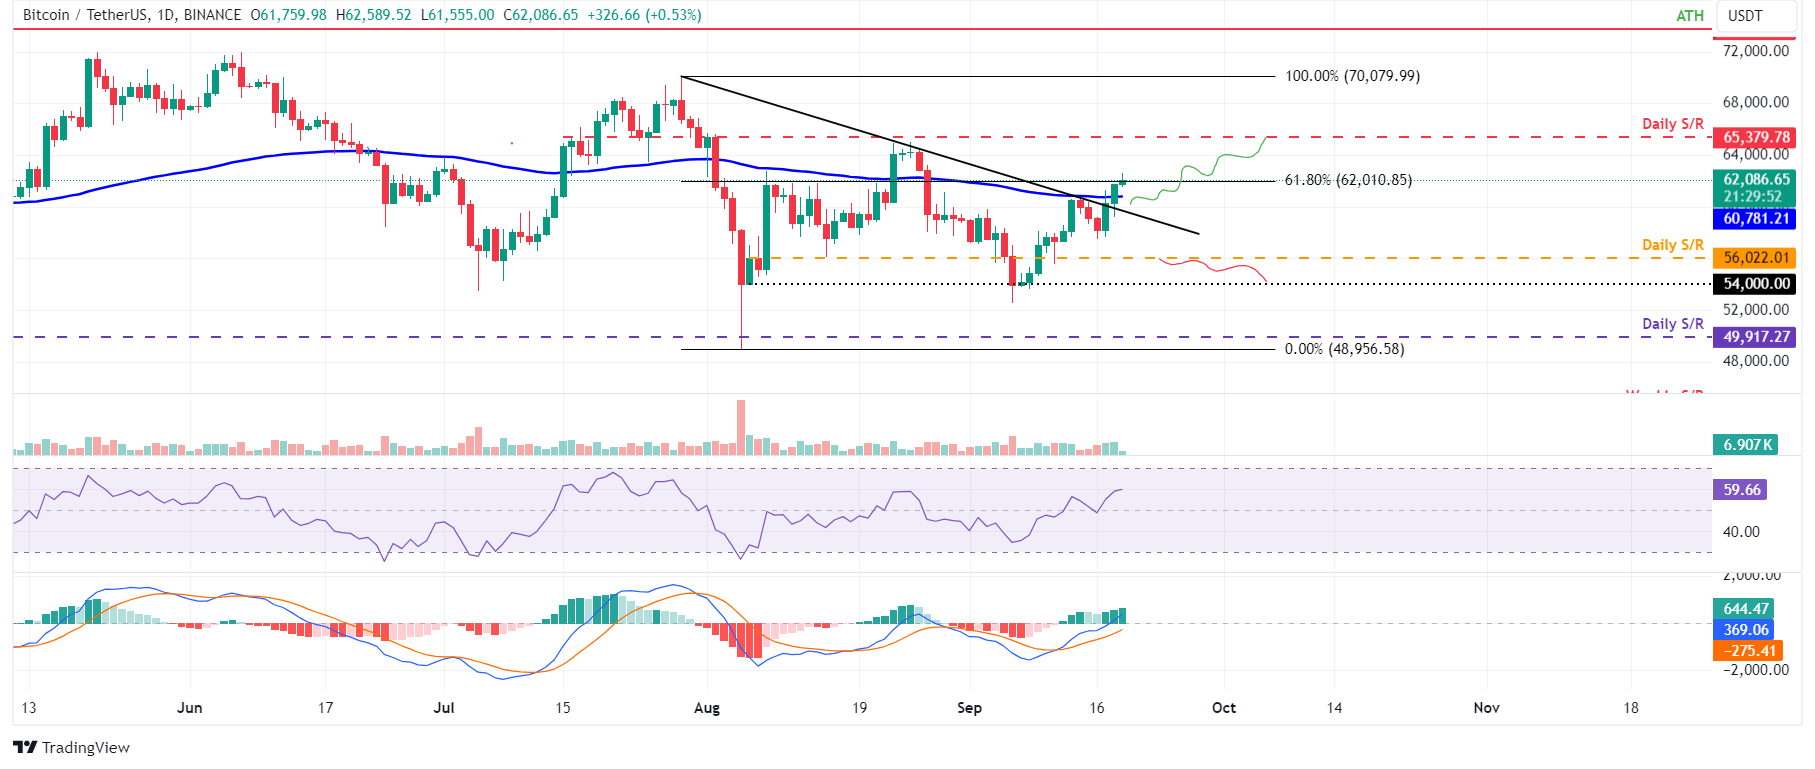
Bitcoin prices rose above a descending trendline (drawn from multiple highs from late July) on Wednesday and closed above the 100-day exponential moving average (EMA) of $60,781, which it had failed to surpass last week. As of writing on Thursday, it is trading just above the 61.8% Fib retracement level near $62,000.
If BTC manages to close near the 61.8% Fib retracement level of $62,000, it could rise by 5.6% to retest the daily resistance at $65,379.
The Moving Average Convergence Divergence (MACD) indicator further supports Bitcoin’s rise, showing a bullish crossover on the daily chart. The MACD line (blue line) has risen above the signal line (yellow line), giving a buy signal. The green histogram bars are showing a rise above the neutral line zero, also suggesting that Bitcoin price may move higher.
Moreover, the Relative Strength Index (RSI) is above the neutral level of 50, indicating bullish momentum.

BTC/USDT daily chart
However, the bullish thesis will be invalidated if BTC breaks down from the downtrend line and closes below the daily support level of $56,022. The drop could extend by 3.6% and potentially retest the psychologically important level of $54,000.
Ethereum price shows signs of recovery
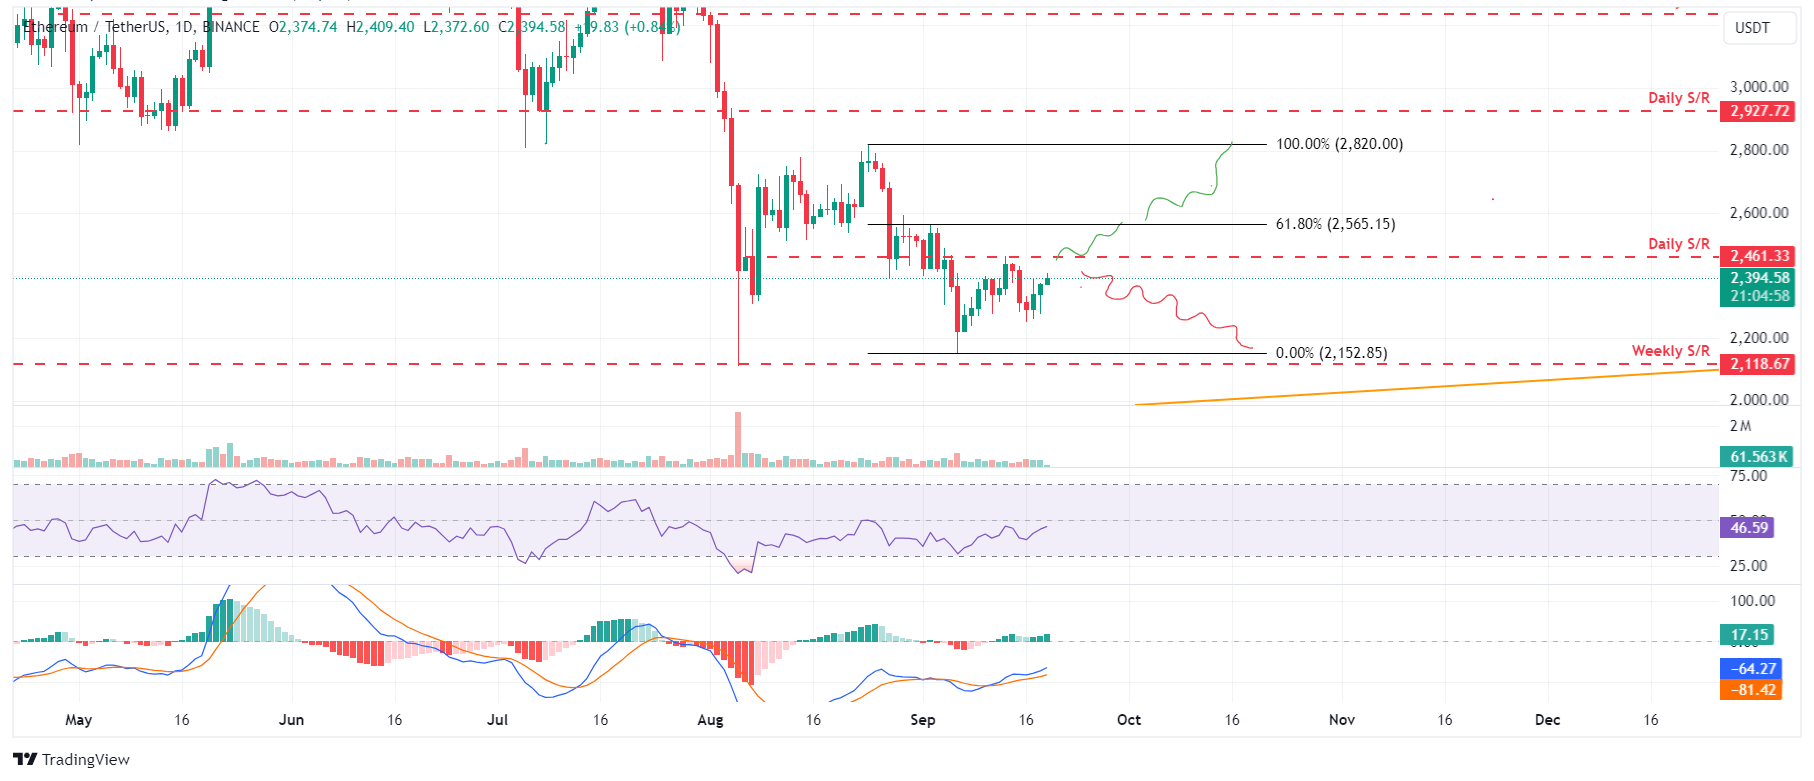
Ethereum prices failed to close above the daily resistance level of $2,461 on Sept. 13 and subsequently fell 5.88% over the three days, but recovered 3.4% from Tuesday to Wednesday. It continued to recover on Thursday, trading at $2,394, approaching the daily resistance level of $2,461.
If ETH rises and closes above $2,461, it could extend the upside by 5% and retest the 61.8% Fib retracement level of $2,565 (from the August 24 high of $2,820 to the September 6 low of $2,152).
The MACD indicator further supports Ethereum’s rise and is showing a bullish crossover on the daily chart. The MACD line has risen above the signal line, giving a buy signal. The green histogram bars are showing a rise above the neutral line zero, also suggesting that Ethereum price may move higher.
Meanwhile, the RSI is little changed and remains very close to the neutral level, indicating a lack of momentum.

ETH/USDT daily chart
On the other hand, if Ethereum fails to close above the daily resistance level at $2,461, it can drop further and retest the September 6 low of $2,152.
Ripple price trends suggest upside potential
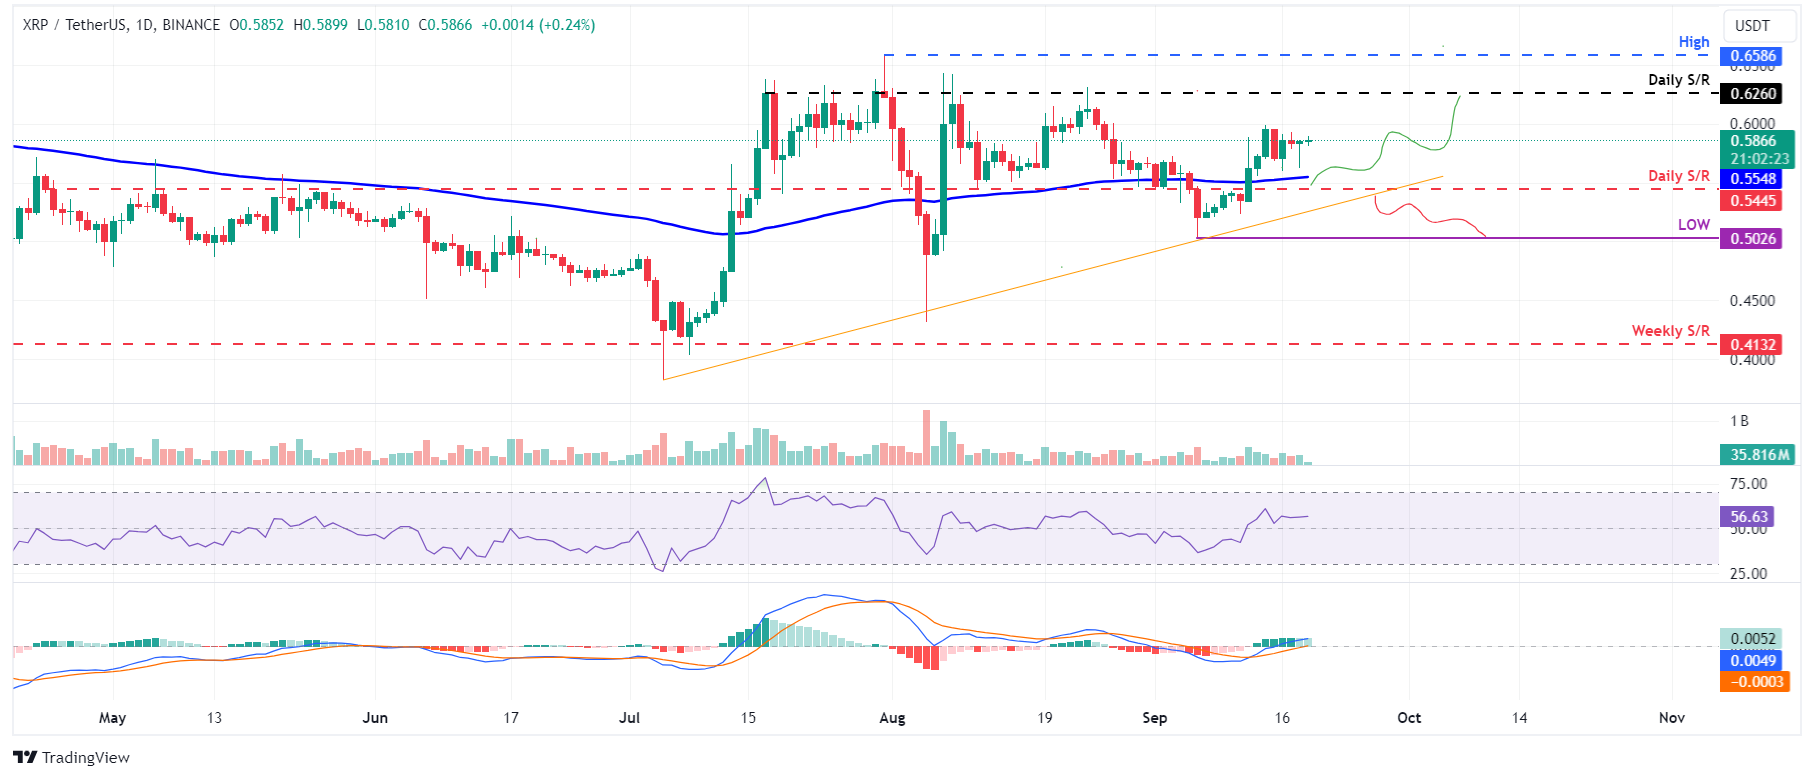
Ripple price retested the 100-day EMA on Wednesday and bounced back at $0.554. The 100-day EMA is aligned with the daily support level at $0.544, which acts as a critical support zone. As of Thursday, it is trading above $0.586.
If the 100-day EMA and the daily support near $0.544 continue to hold, XRP could continue its uptrend and retest the daily resistance level at $0.626.
The MACD indicator is further supporting Ripple’s rise and is showing a bullish crossover on the daily chart. The MACD line has risen above the signal line, giving a buy signal. The green histogram bars are showing a rise above the neutral line zero, also suggesting that Ripple price may experience some upward momentum.
Moreover, the RSI is trading above the neutral level of 50, indicating bullish momentum.

XRP/USDT daily chart
However, the bullish outlook will be invalidated if Ripple’s daily candlestick breaks below the daily support level at $0.544 and then drops below the ascending trend line, in which case XRP would fall by 7.5% and retest the September 6 low of $0.502.
Bitcoin, Altcoins and Stablecoins FAQ
Bitcoin is the largest cryptocurrency by market capitalization and is a virtual currency designed to function as money. This payment method cannot be controlled by any person, group, or entity, eliminating the need for a third party to be involved during financial transactions.
An altcoin is a cryptocurrency other than Bitcoin, although some consider Ethereum a non-altcoin since it is the cryptocurrency that caused the fork. If this is the case, Litecoin would be the first altcoin to be forked from the Bitcoin protocol, and therefore an “improvement” of Bitcoin.
A stablecoin is a cryptocurrency designed to have a stable price, whose value is backed by a reserve of the asset it represents. To achieve this, a stablecoin's value is pegged to a commodity or financial instrument, such as the US Dollar (USD), and its supply is adjusted algorithmically or by demand. The primary purpose of stablecoins is to provide an on/off ramp for investors who want to trade and invest in cryptocurrencies. Also, since cryptocurrencies are generally subject to volatility, stablecoins allow investors to store value.
Bitcoin dominance is the ratio of Bitcoin's market cap to the total market cap of all cryptocurrencies. It is a clear indication of Bitcoin's interest among investors. High BTC dominance usually occurs before and during bull markets, when investors are enticed to invest in relatively stable and high market cap cryptocurrencies like Bitcoin. When BTC dominance falls, it usually means that investors are moving their capital and profits into altcoins in search of higher returns, which usually causes altcoin spikes.

