Monero's price rose significantly at the beginning of the year, but XMR could not maintain its price momentum. Recently, XMR's price has been correcting. Last week, Monero fell by 8%. On the daily chart, XMR lost 0.4% of its value.
Currently, the altcoin is stabilizing below the nearest resistance. The technical outlook for Monero is also in favor of the bears, with the demand for the coin dropping on the charts. Accumulation also declined as buying momentum weakened.
While altcoins are still hovering around the most recent resistance levels, bulls get exhausted every time altcoins try to break out of the most recent price cap. Bitcoin needs to start recovering on the charts for the overall market to gain momentum.
The bulls may be back, as shown by the golden cross on the daily chart. Monero’s market cap is falling, indicating that sellers are starting to take control of the price at the time of writing.
Monero Price Analysis: 1-day Chart

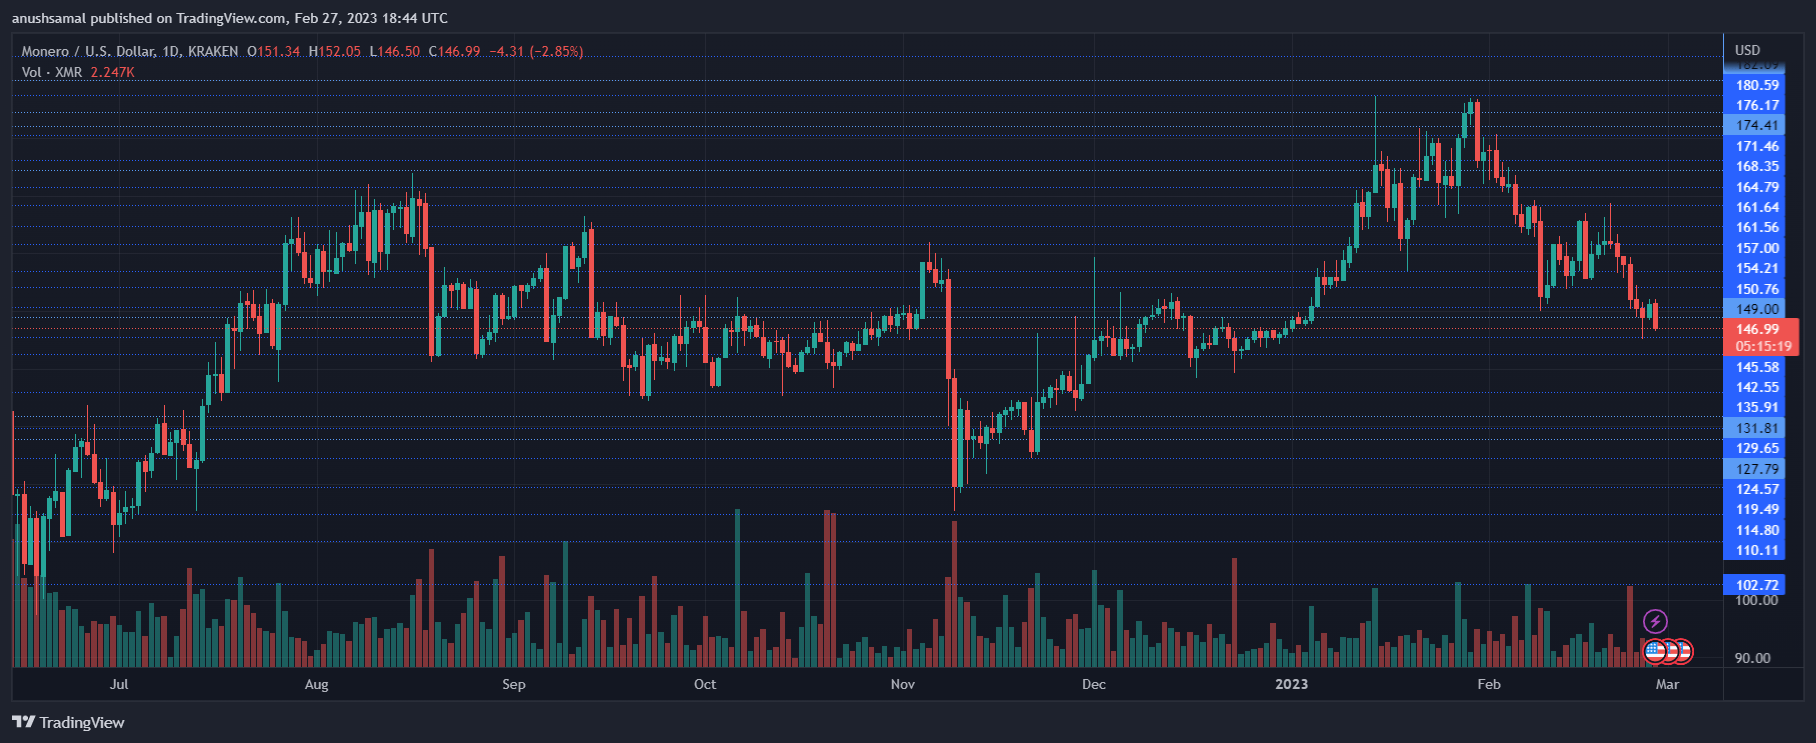
XMR was trading at $146 at the time of writing. The altcoin has been struggling below the $150 resistance level for some time now. For the bulls to gain the upper hand, the coin needs to surpass the $150 price ceiling. Only once that happens can XMR begin a bullish recovery.
Monero’s local support level is at $141, below which the bears will take control of the asset price. The volume of XMR traded in the last session was declining, indicating weaker buying momentum at the time of writing.
Technical Analysis

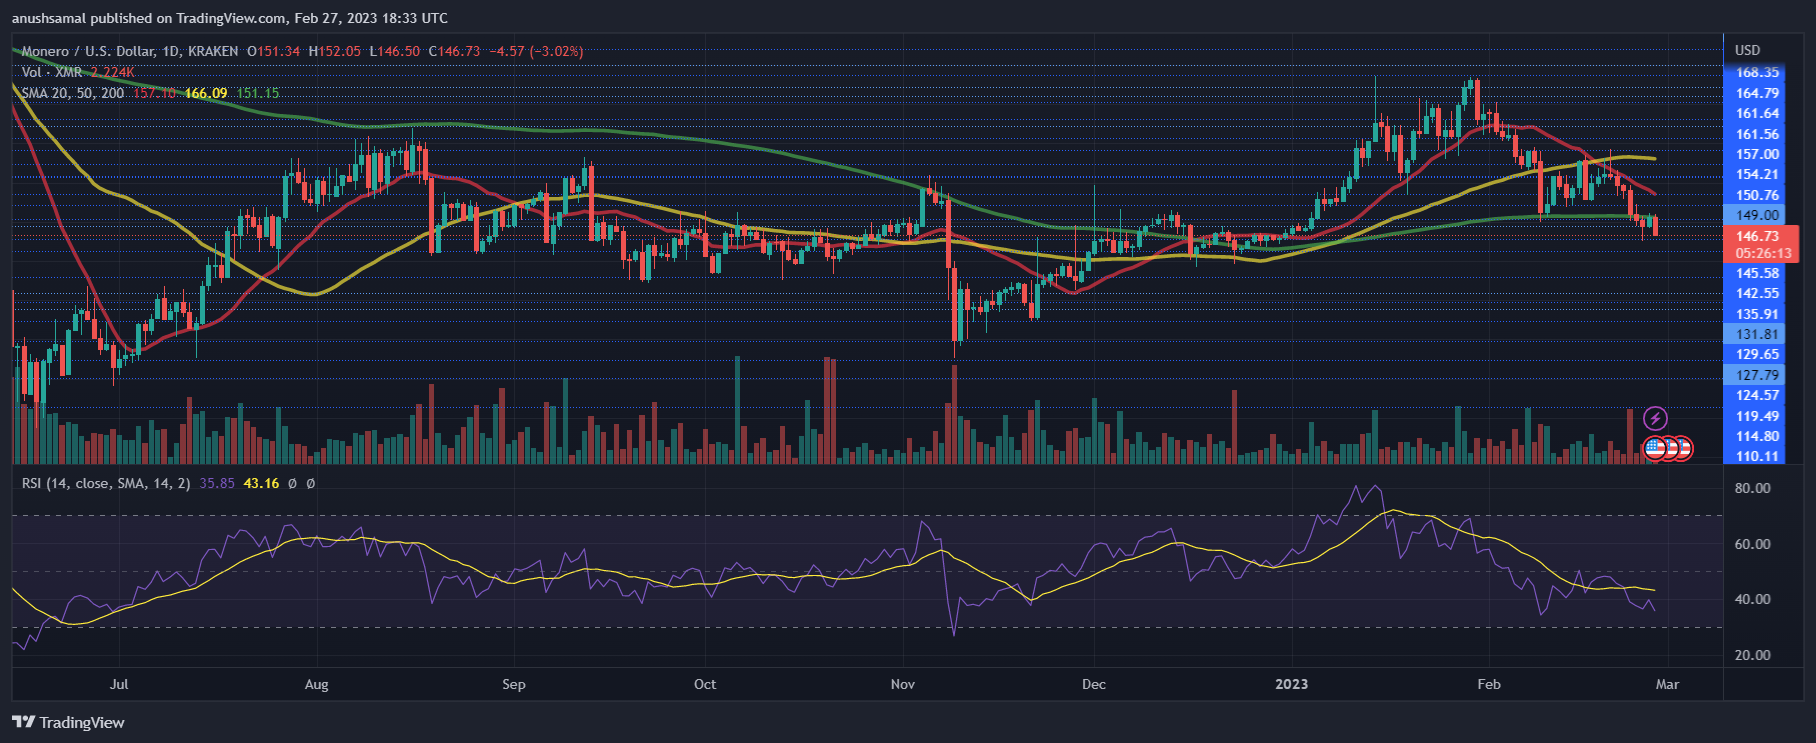
The altcoin formed a golden cross on the daily chart. A golden cross is associated with bullish price momentum in the market. It occurs when a longer moving average rises above a shorter moving average. In Monero's case, the 50 Simple Moving Average (SMA) rose above the 20 Simple Moving Average.
Currently, Monero price is below the 20-day SMA as sellers are driving the price momentum in the market. The Relative Strength Index has fallen below the half line, indicating that buying pressure has weakened over the past few weeks.

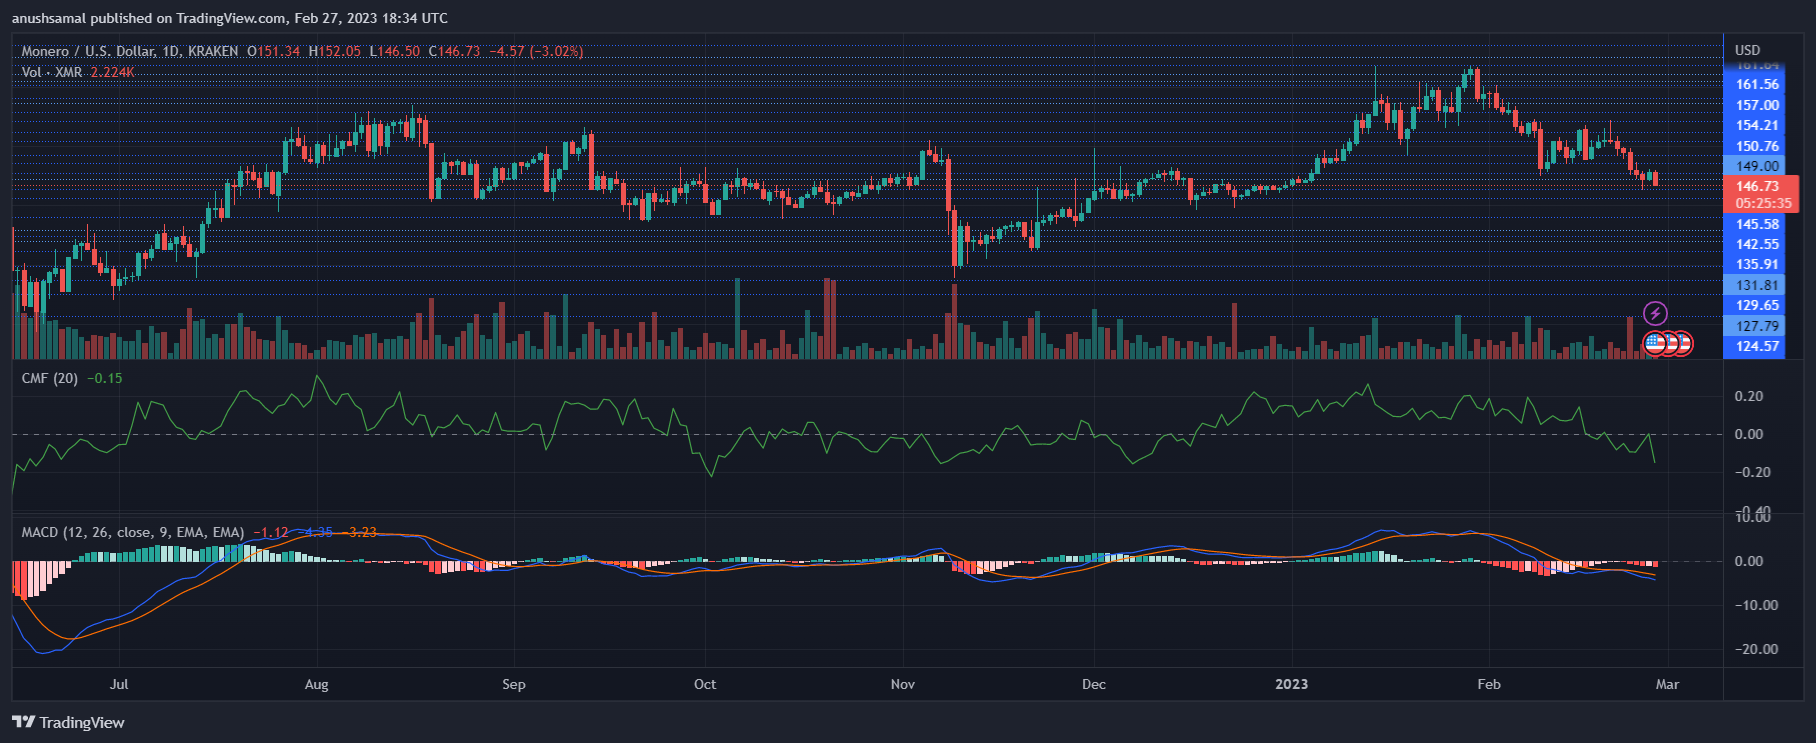
XMR has shown a sell signal on the chart as bearish pressure remains on the daily chart. The moving average convergence divergence has formed a red signal bar indicating bearish momentum and a sell signal for Monero.
The Chaikin Money Flow was also negative in other indicators. This indicator, which measures capital inflows and outflows, was below the halfway line, indicating that capital inflows had decreased at the time of writing.
Featured image from UnSplash, chart from TradingView.com.

